Getting Started
Welcome to MetaChrome!
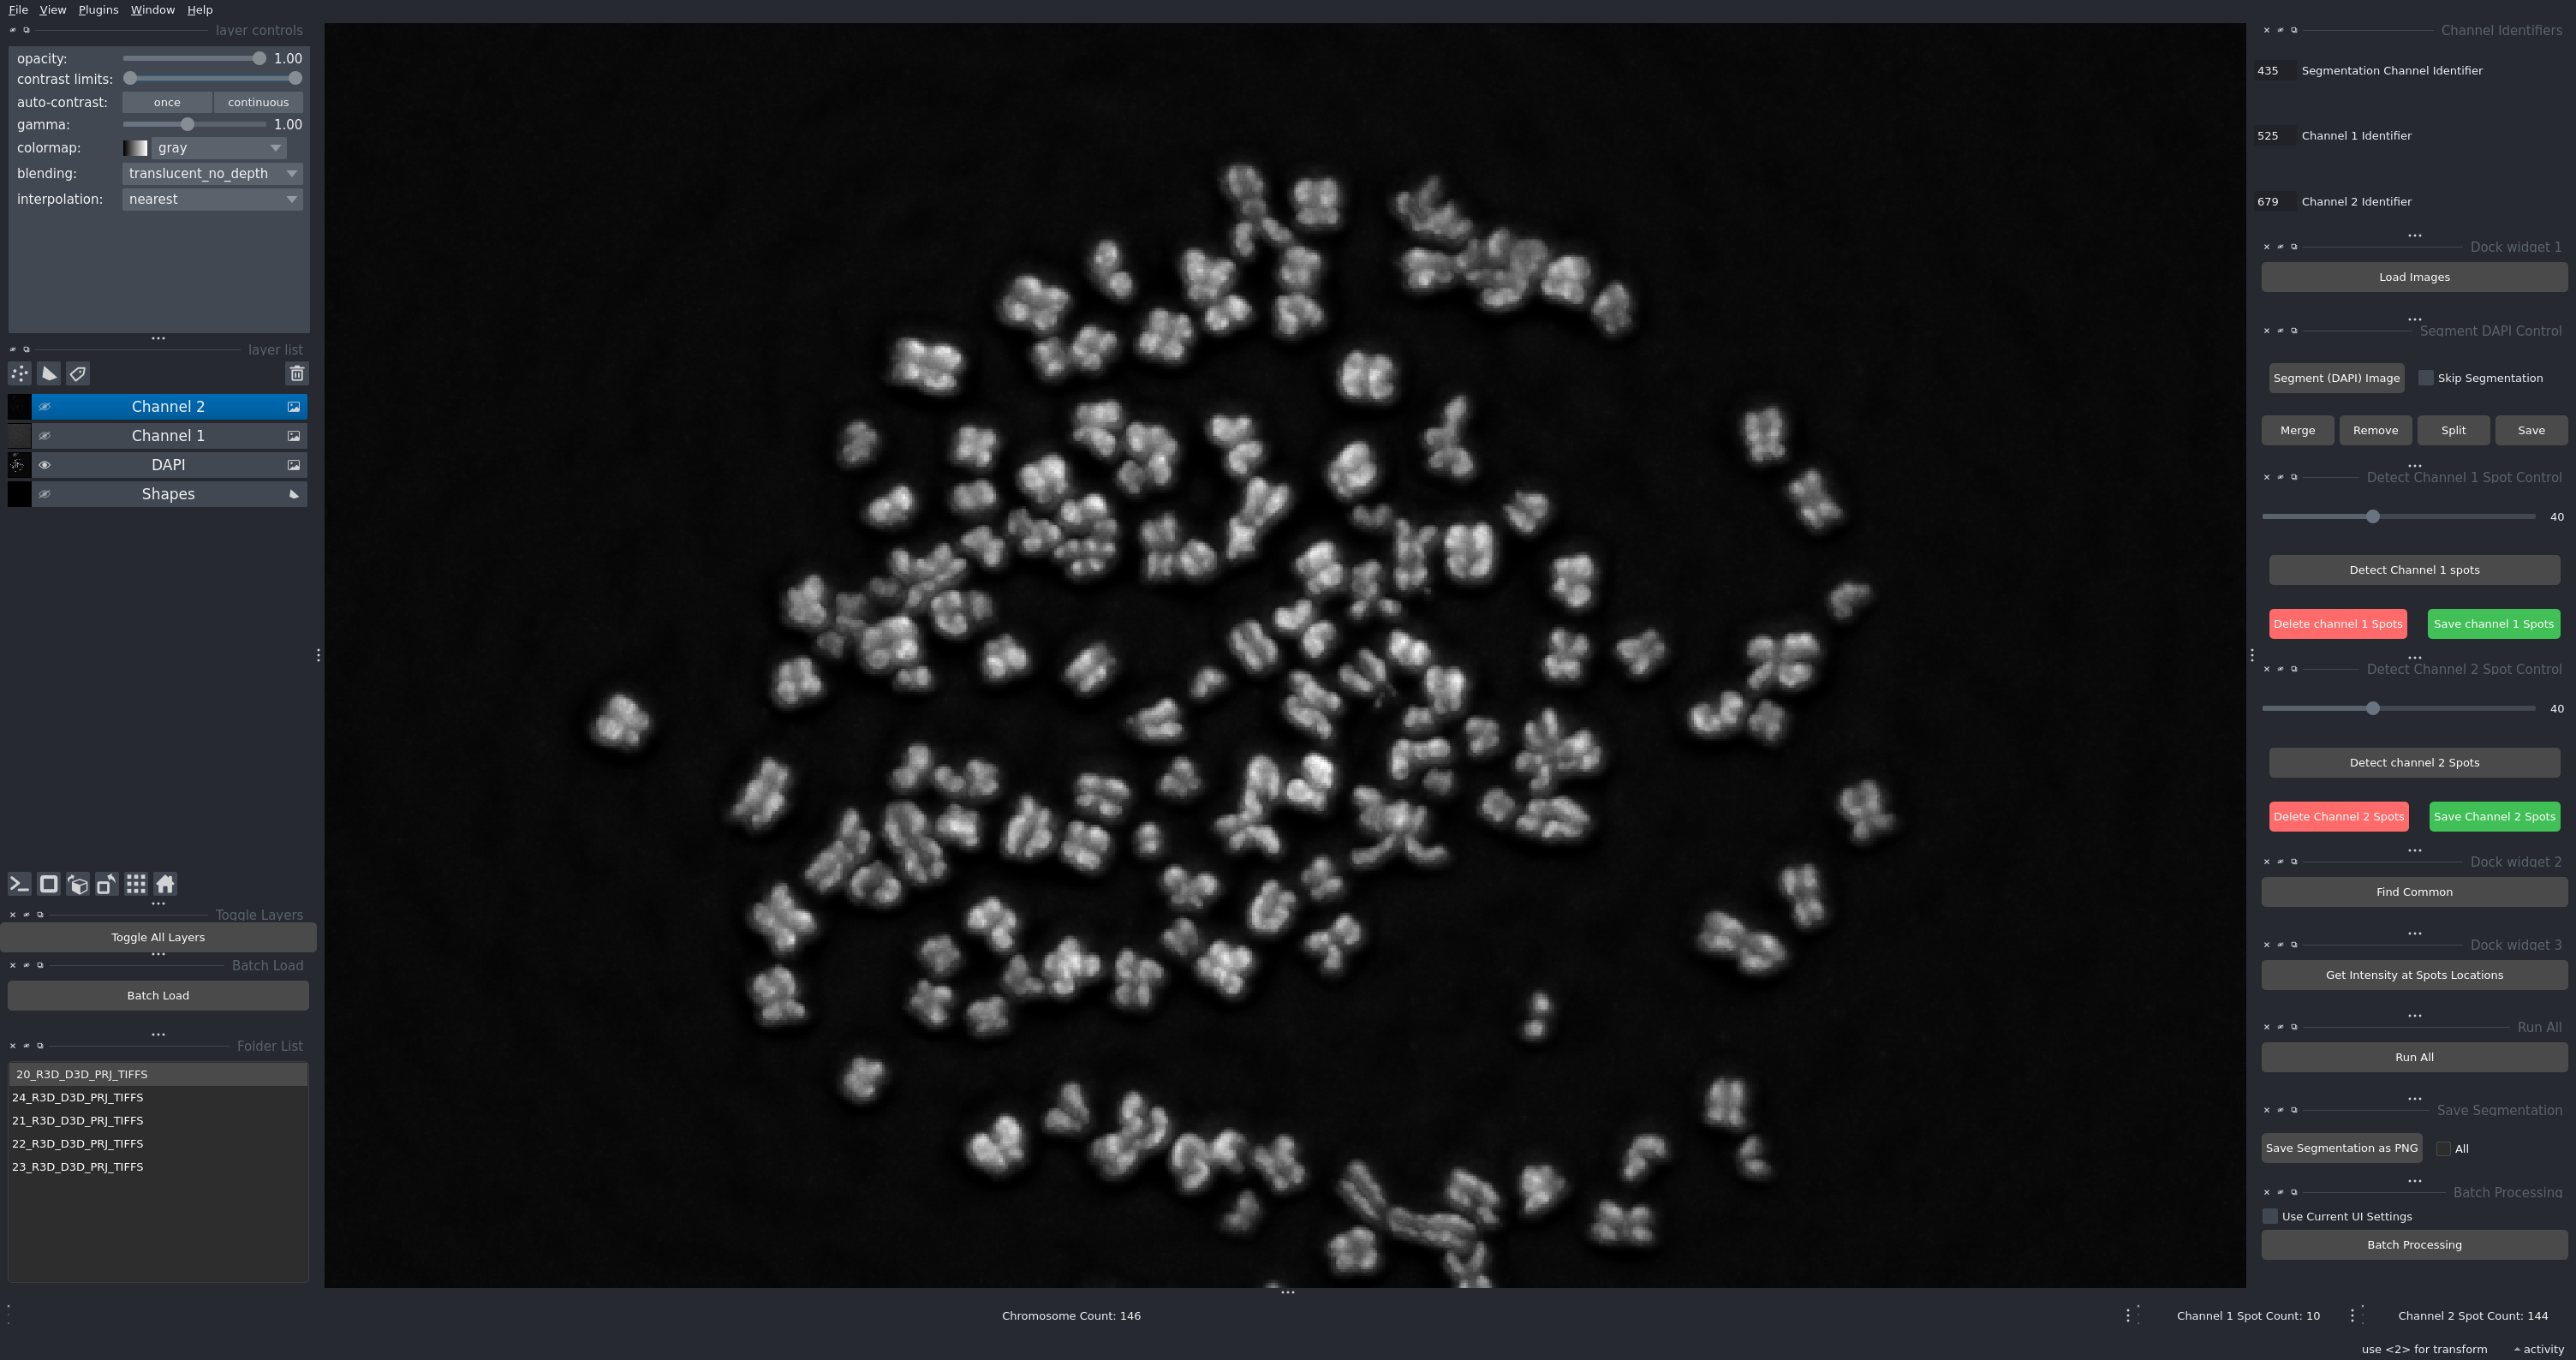
The MetaChrome toolkit interface
Overview
MetaChrome is a comprehensive solution for analyzing metaphase chromosomes using advanced image processing techniques. Built on the powerful Napari platform, it combines automated segmentation with interactive visualization and manual correction tools.
What is MetaChrome?
This toolkit provides researchers with:
Automated chromosome segmentation using trained Cellpose models
Multi-channel fluorescence analysis for DAPI, DNA-FISH, and protein markers
Spot detection and quantification with customizable thresholds
Interactive visualization in the Napari viewer
Batch processing for high-throughput analysis
Manual correction tools for quality control
Key Features
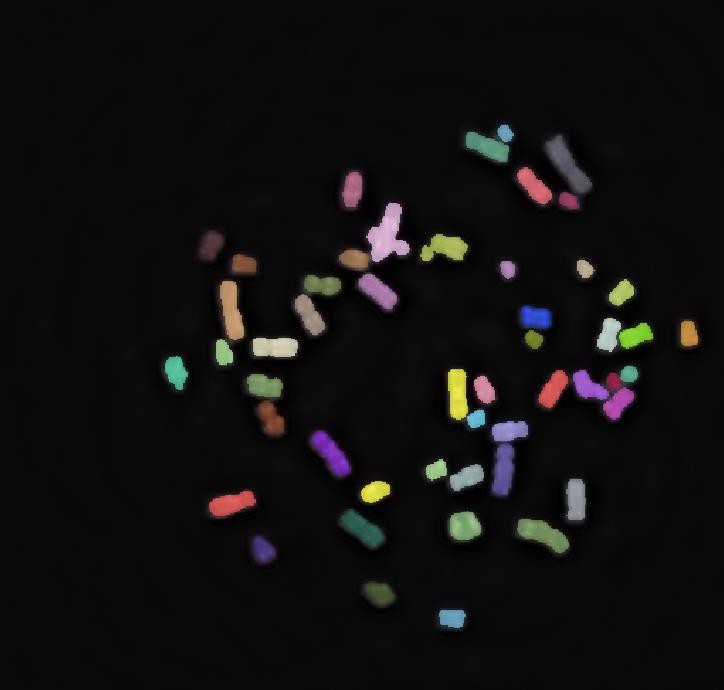
Automated Segmentation
Uses trained Cellpose models to automatically identify and segment individual metaphase chromosomes from DAPI images with high accuracy.
Multi-Channel Spot Detection
Detects and localizes DNA-FISH and CENP-C spots with adjustable threshold controls for optimal sensitivity and specificity.
Co-localization Analysis
Identifies regions where multiple signals overlap, enabling precise quantification of signal co-localization between channels.
Interactive Visualization
Built on Napari, providing powerful multi-dimensional image viewing with layer controls, zoom, pan, and real-time visualization of analysis results.
Manual Correction Tools
Provides interactive tools for refining automated results:
Merge incorrectly split chromosomes
Remove unwanted regions
Delete false-positive spots
Save and reload corrections
Batch Processing
Process multiple image folders automatically with consistent parameters, generating individual and summary results files for high-throughput workflows.
Who Should Use This?
This toolkit is designed for researchers working on:
Chromosome Structure Analysis: Quantitative assessment of metaphase chromosome morphology
Centromere Studies: CENP-C localization and intensity measurements
DNA-FISH Analysis: Detection and quantification of specific DNA sequences
Signal Co-localization: Spatial relationships between different fluorescent markers
High-Throughput Screening: Automated analysis of large image datasets
Image Requirements
The software works with multi-channel fluorescence microscopy images:
Required Channels:
DAPI channel: For chromosome segmentation (nuclear/chromosome staining)
DNA-FISH channel (Channel 1): For detecting specific DNA sequences
Protein marker channel (Channel 2): For detecting proteins of interest (e.g., CENP-C, CENP-A, histone modifications)
Supported Formats:
TIFF (recommended for microscopy data)
PNG
JPG
Naming Convention:
Images should contain identifiable strings in their filenames:
Example:
sample_001_w435.tif(DAPI),sample_001_w525.tif(DNA-FISH),sample_001_w679.tif(Protein marker)Or:
cell1_dapi.tif,cell1_dna_fish.tif,cell1_protein.tif
The identifiers can appear anywhere in the filename and are configurable in the interface.
Typical Workflow
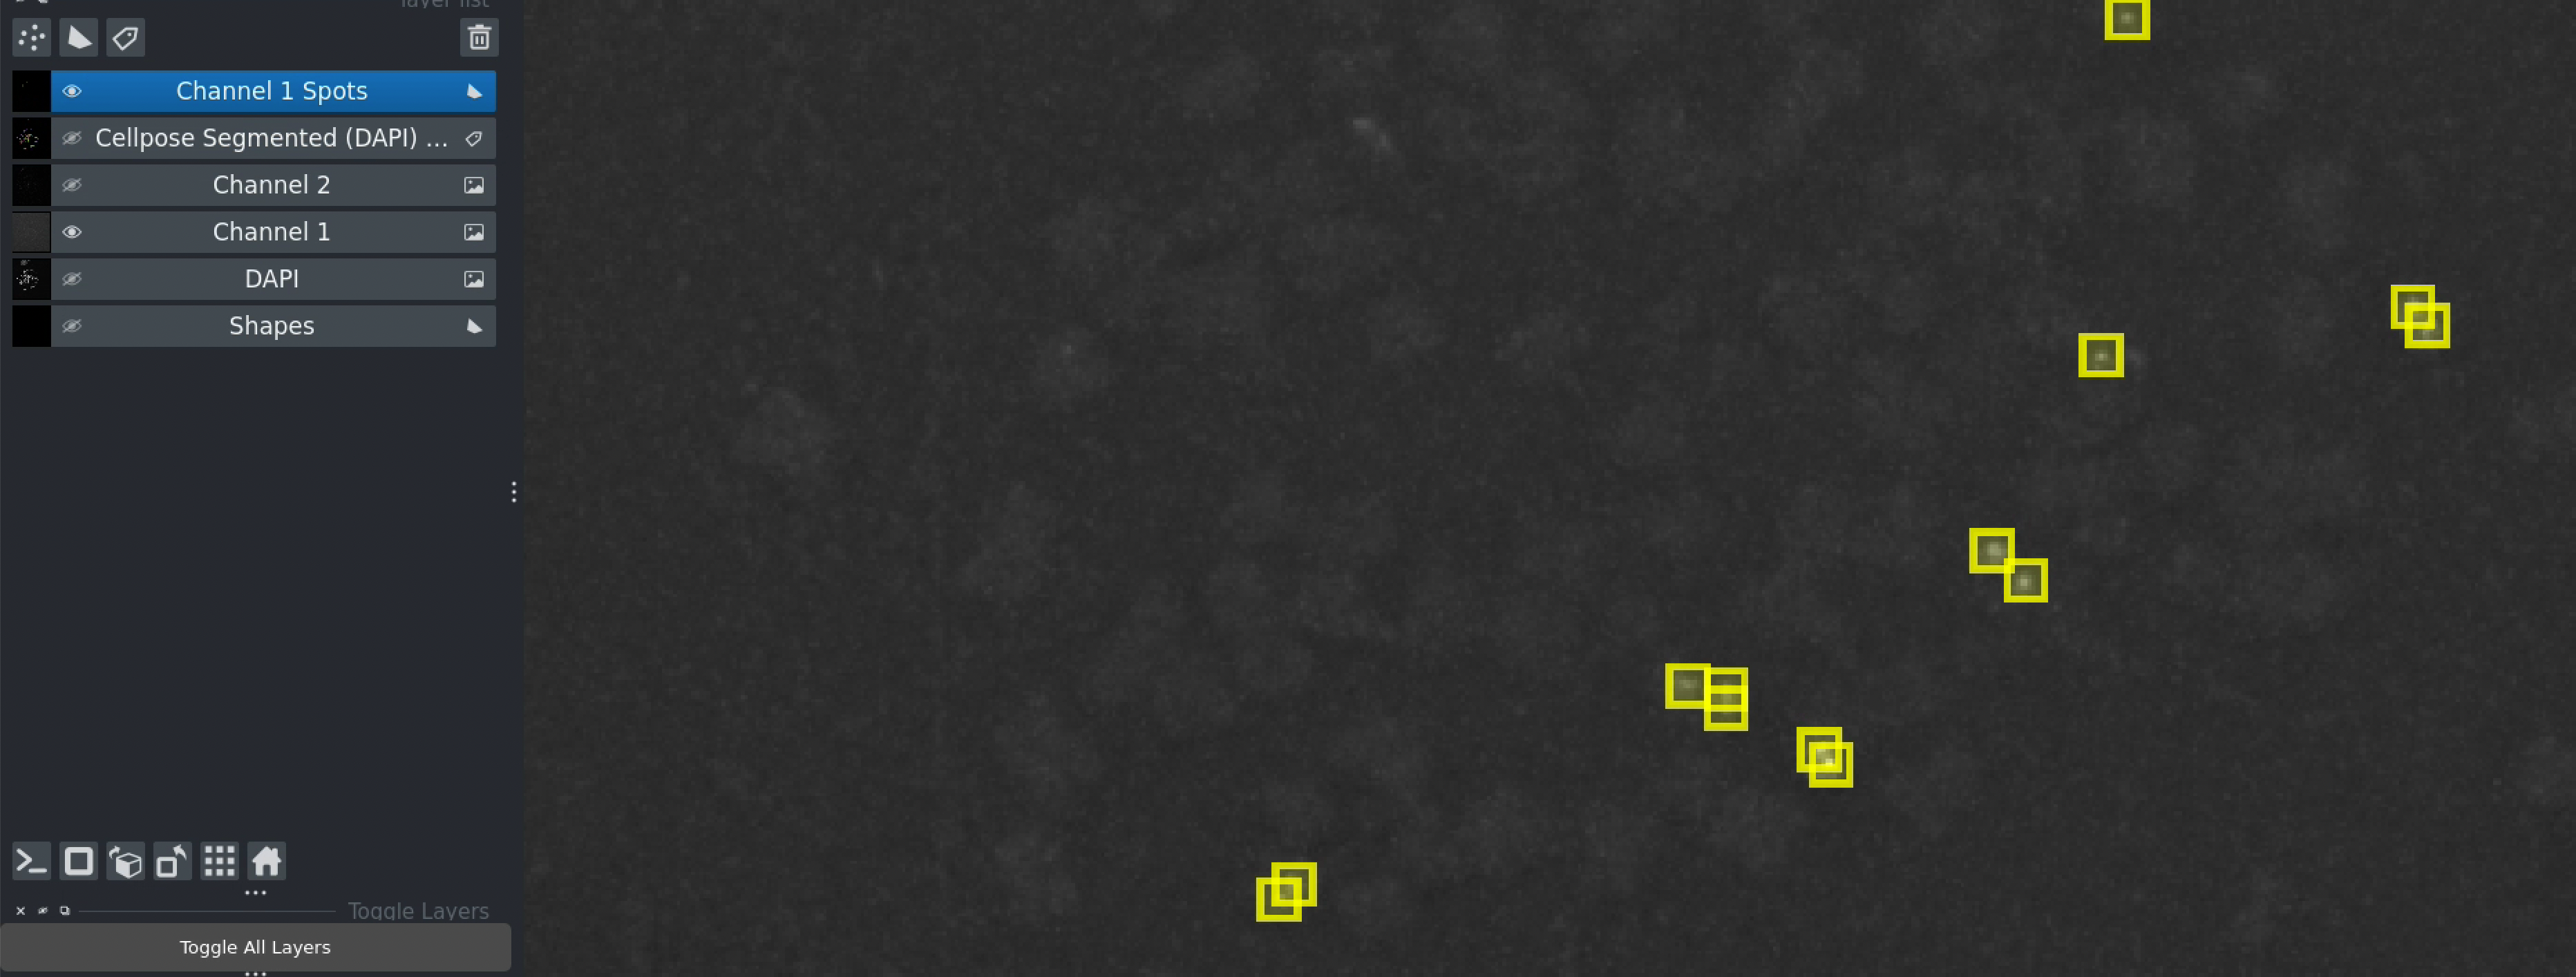
Example of spot detection results in the analysis workflow
A typical analysis consists of:
Configure channel identifiers to match your image naming
Load multi-channel fluorescence microscopy images
Segment chromosomes using Cellpose-based detection
Detect DNA-FISH and CENP-C spots with threshold controls
Analyze co-localization by finding common regions
Measure signal intensities at spot locations
Export results as CSV files for further analysis
Use Cases
Single Image Analysis
For detailed analysis of individual metaphase spreads with manual quality control and correction.
Batch Processing
For high-throughput analysis of large datasets with consistent parameters across all images.
Interactive Exploration
For exploratory analysis where parameters are optimized interactively before batch processing.
Output and Results
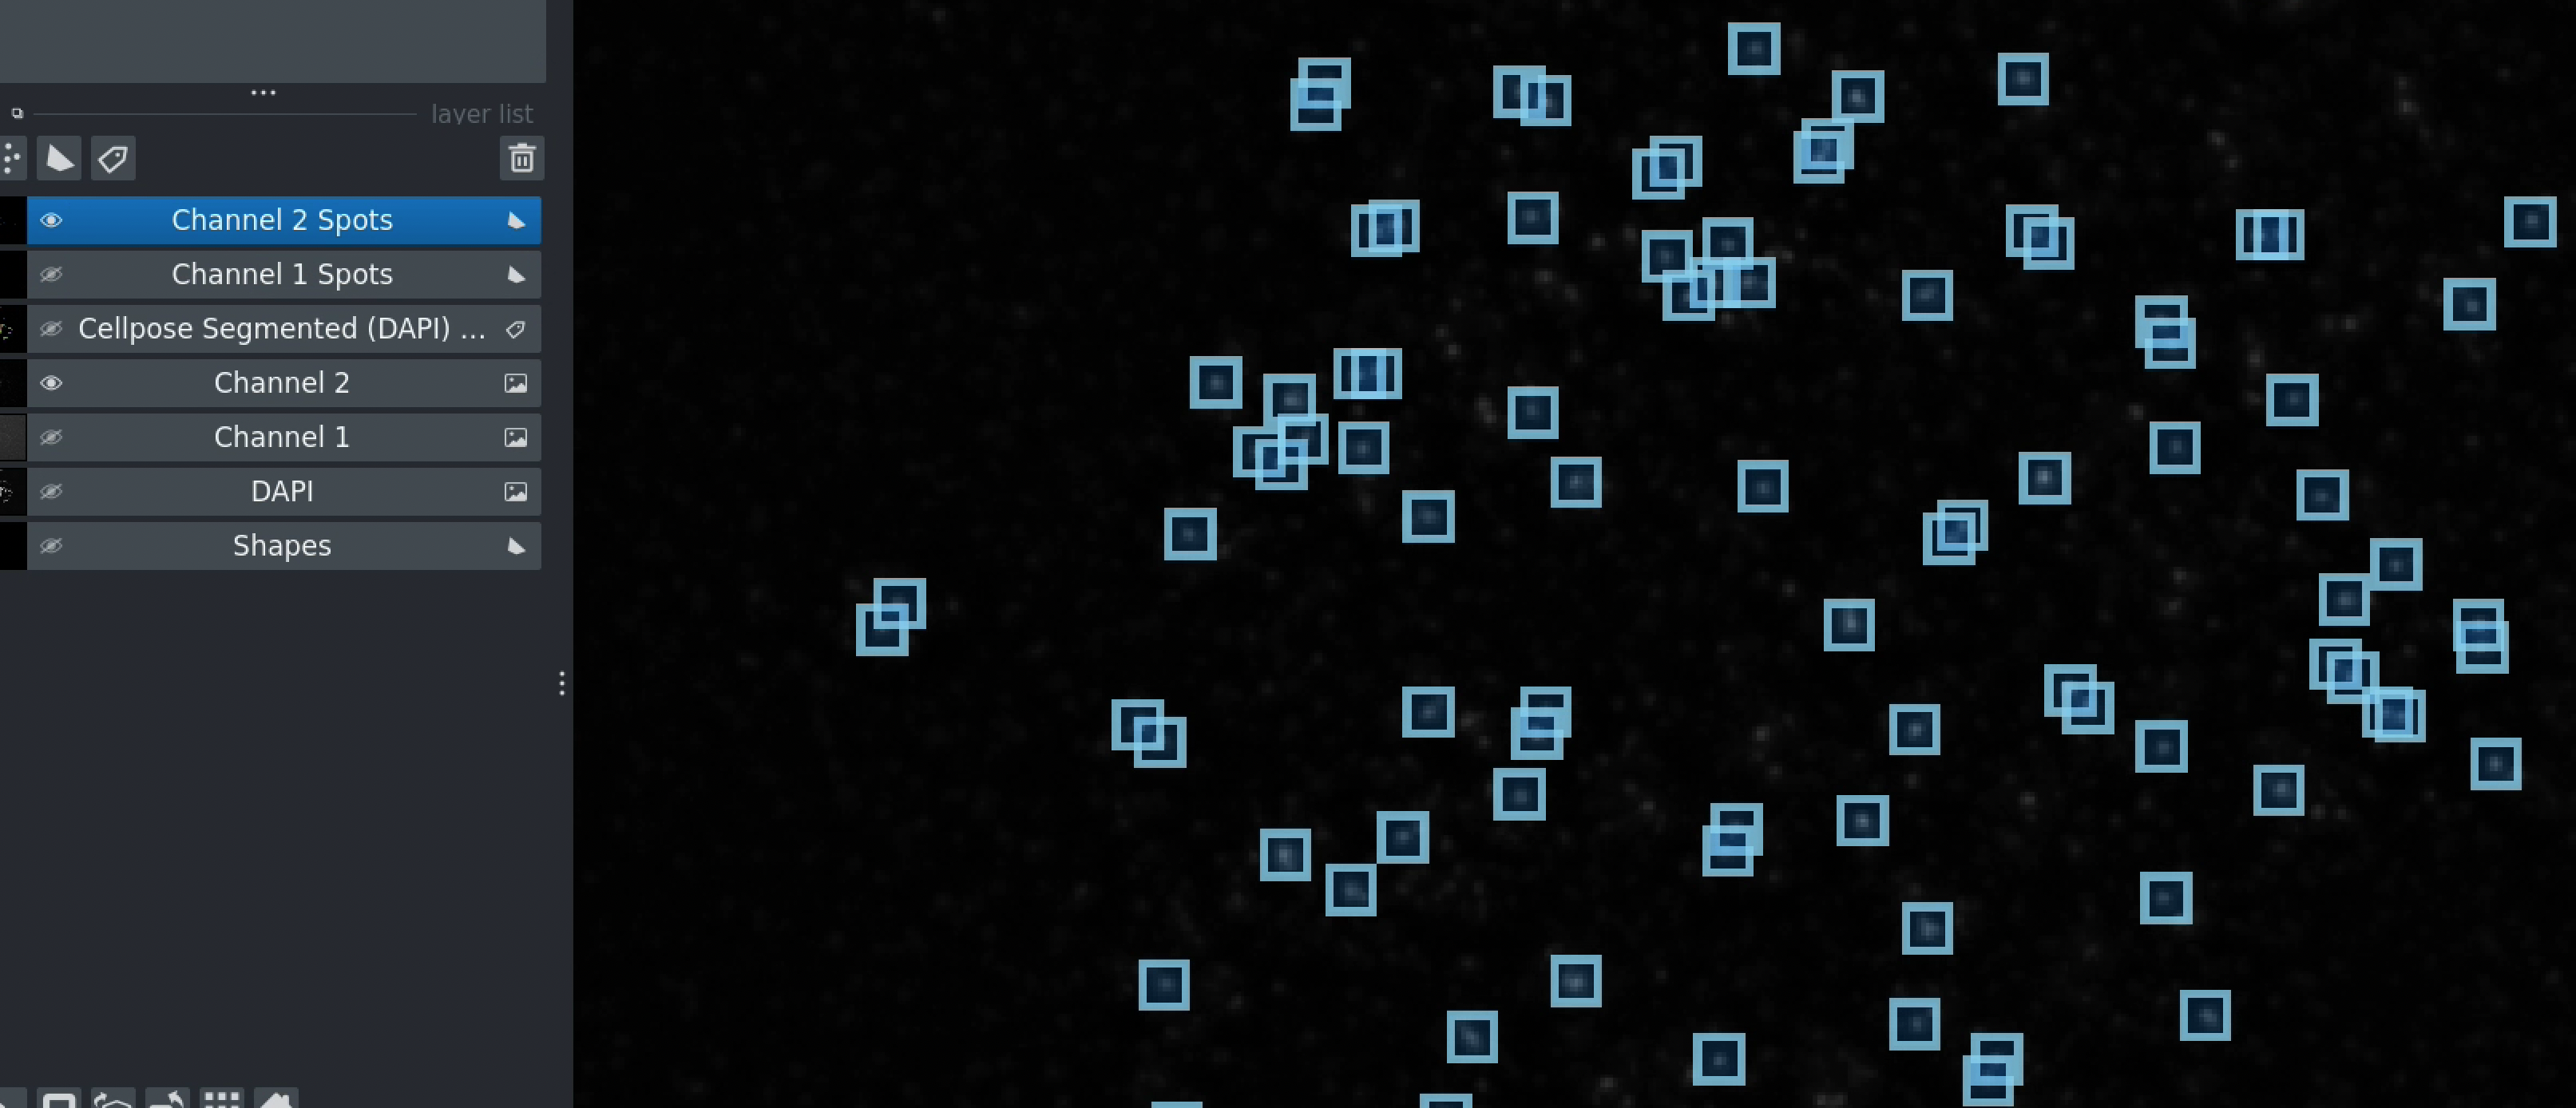
Complete analysis showing detected spots in both channels
The toolkit generates:
Visual overlays showing segmented chromosomes and detected spots
CSV data files with coordinates and intensity measurements
Summary statistics for batch processed datasets
Exportable images for presentations and publications
Performance
Processing Speed:
Single image: ~30-60 seconds (with GPU)
Batch of 100 images: ~1-2 hours (with GPU)
GPU acceleration highly recommended for Cellpose segmentation
Accuracy:
Chromosome segmentation: Comparable to manual annotation
Spot detection: Adjustable sensitivity via threshold controls
Manual correction: Interactive refinement for maximum accuracy
Getting Help
Questions or Issues?
Email: sagarm2@nih.gov
Institution: HITIF/LRBGE/CCR/NCI (National Cancer Institute/NIH)
Next Steps
Ready to get started?
Installation - Install the software and dependencies
tutorial - Follow the quick start tutorial
Basic Workflow - Learn the complete analysis workflow
Citation
If you use this toolkit in your research, please cite:
bioRxiv preprint: https://www.biorxiv.org/content/10.1101/2025.09.02.673813v1
Author: Md Abdul Kader Sagar Affiliation: HITIF/LRBGE/CCR/NCI (National Cancer Institute/NIH) Email: sagarm2@nih.gov
License
This project is developed at the National Cancer Institute/NIH.