Tutorial
This tutorial will guide you through a complete chromosome analysis with MetaChrome. You’ll learn all the steps from launching the application to exporting your results.
Prerequisites
Before starting, ensure you have:
Python 3.8+ installed
All dependencies installed (see Installation)
Sample chromosome images in TIFF format
Trained Cellpose model (if using custom segmentation)
Launch the Application
Start the application from the command line:
python main.py
The Napari viewer window will open with the chromosome analysis interface.
Complete Analysis Workflow
Step 1: Configure Channel Identifiers
Before loading images, set up your channel identifiers to match your image naming:
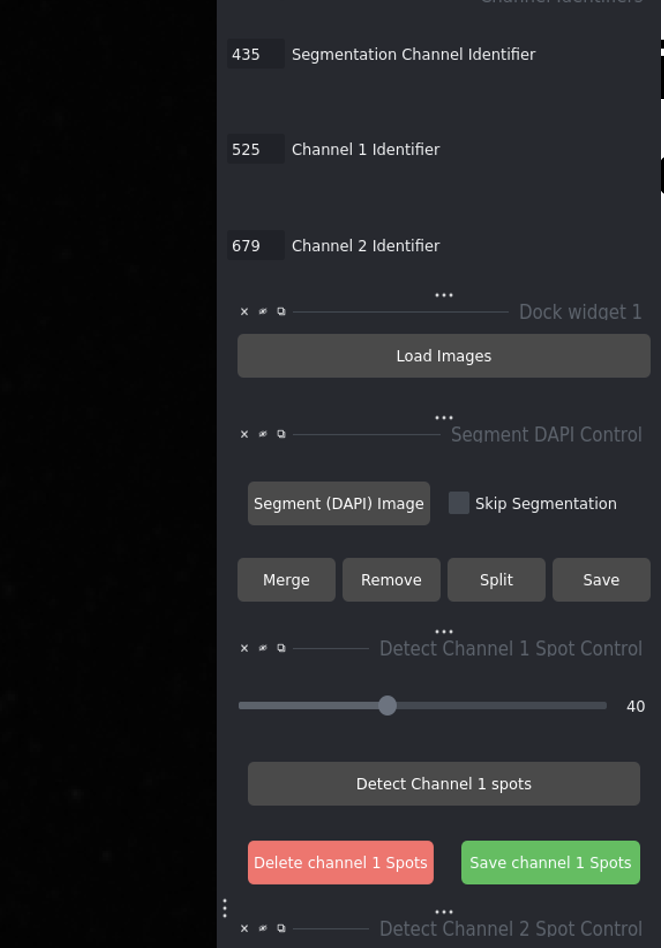
Configure your channel identifiers (e.g., 435 for DAPI, 525 for DNA-FISH, 679 for CENP-C)
DAPI Channel: Identifier in your DAPI image filenames
Channel 1 (DNA-FISH): Identifier for DNA-FISH images
Channel 2 (CENP-C): Identifier for CENP-C images
Step 2: Load Your Images
Click Load Images
Select the folder containing your image files
Your images will appear in the viewer and the folder list
After loading images - the interface shows all available image sets in the list.
Step 3: Segment and Detect
For a complete analysis:
Click Segment (DAPI) Image to identify chromosomes
Adjust the DNA-FISH Threshold slider
Click Detect Channel 1 Spots
Adjust the CENP-C Threshold slider
Click Detect Channel 2 Spots
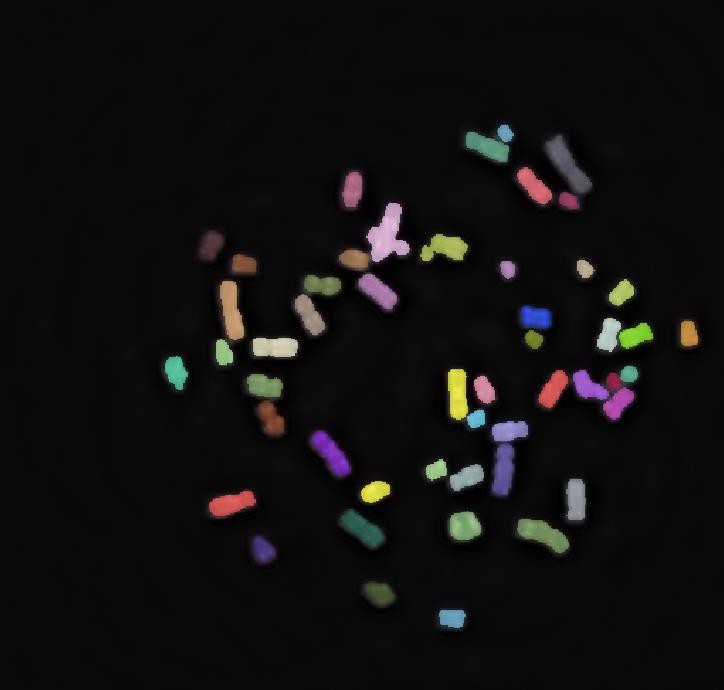
Segmentation result showing individual chromosomes labeled with different colors.
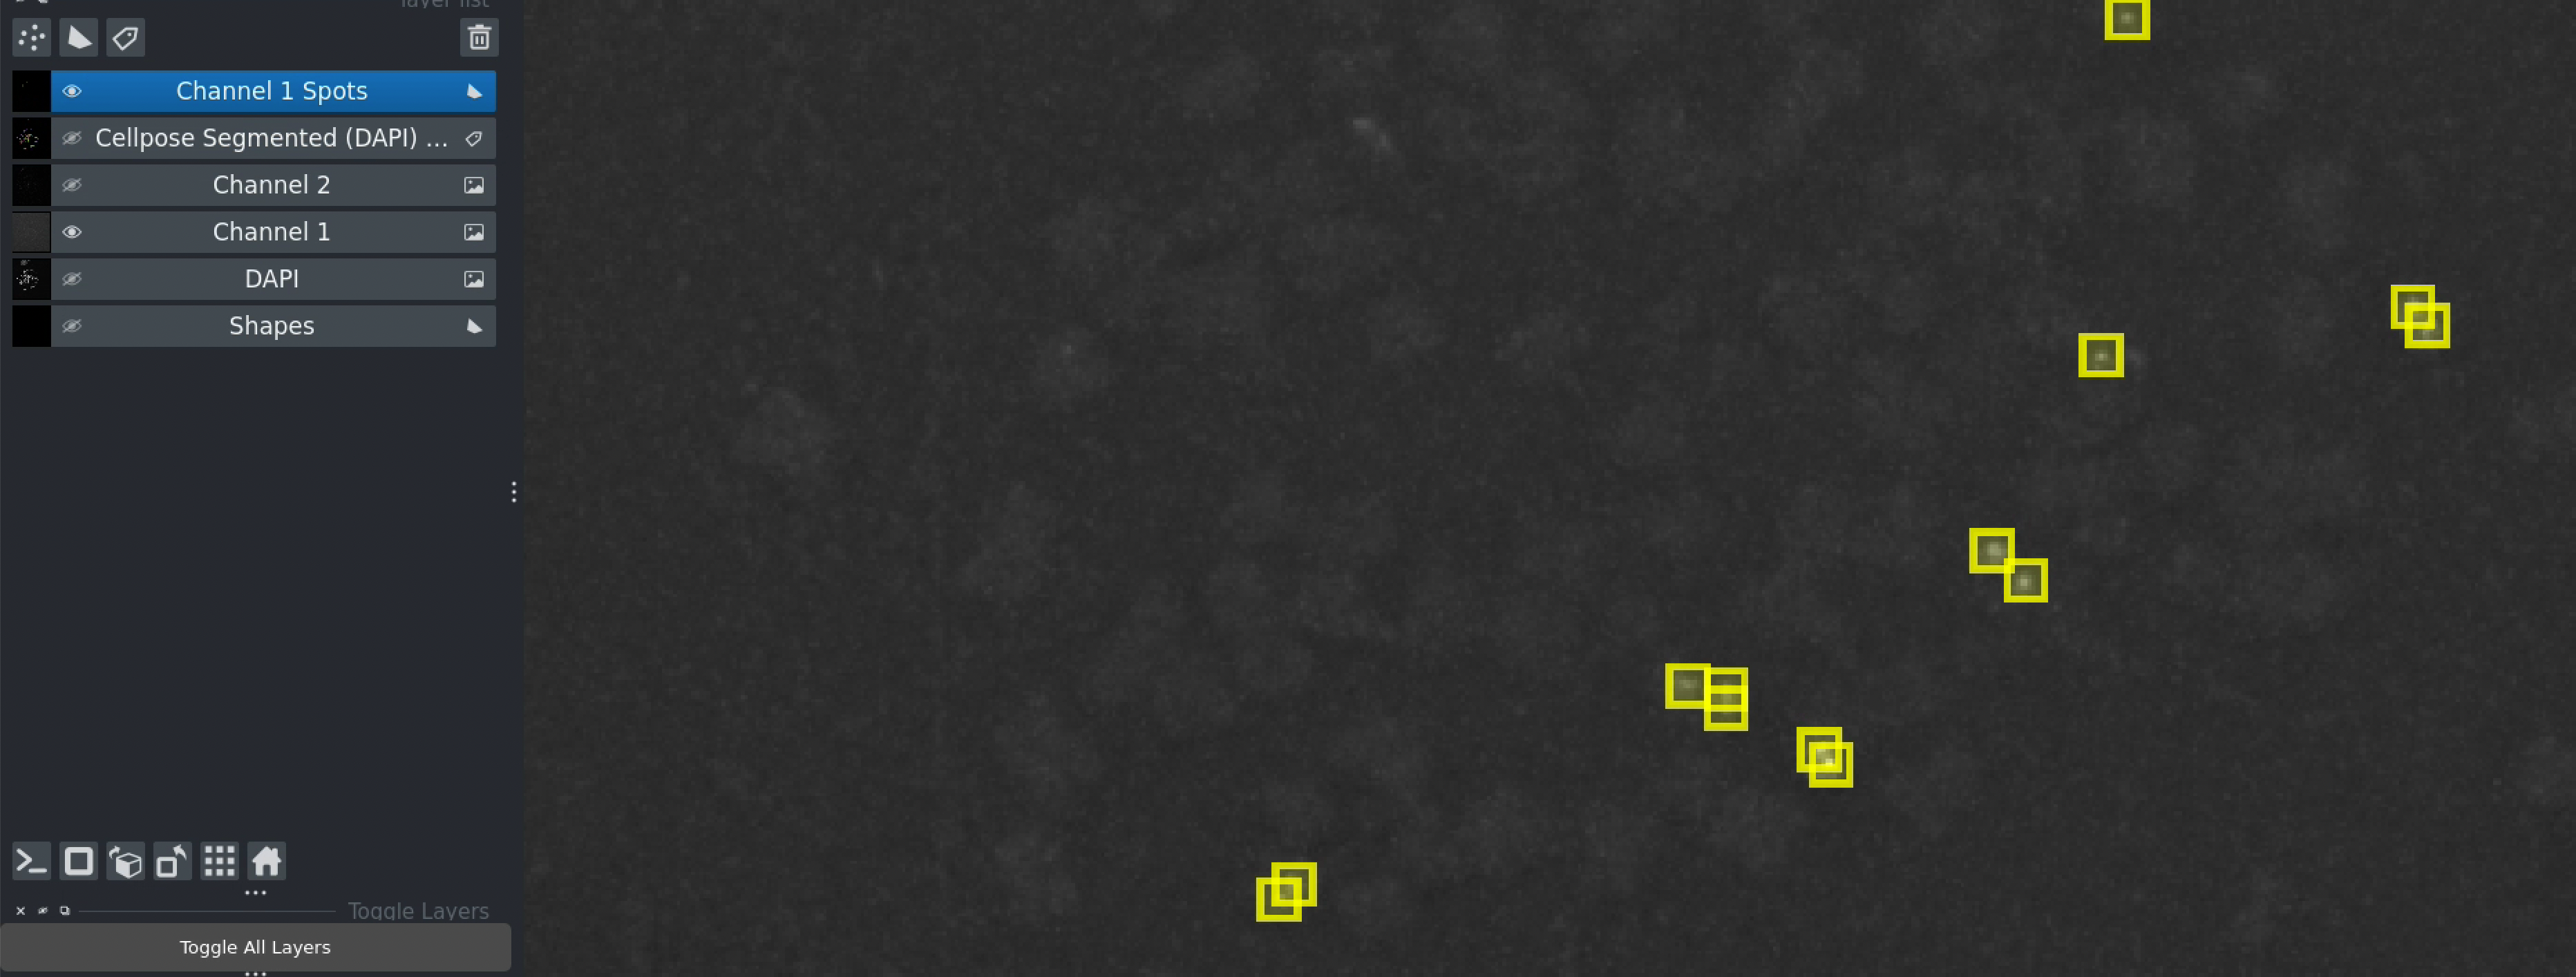
Spot detection - brown markers show detected DNA-FISH spots.
Tip
If you don’t need chromosome segmentation, check Skip Segmentation before loading images.
Step 4: Find Common Regions
Click Find Common to identify regions where both DNA-FISH and CENP-C signals overlap.
This step filters the data to only include meaningful co-localized signals.
Step 5: Get Results
Click Get Intensity at Spots Location to:
Calculate intensities at all detected spots
Export results as a CSV file
Save data in the same folder as your images
Done! Your analysis is complete and results are saved.
Quick Workflow Using “Run All”
For even faster processing:
Configure channel identifiers
Load images
Adjust both threshold sliders to optimal values
Click Run All

Run All automates the entire workflow with one click.
The software will automatically execute all steps and export results.
Batch Processing Multiple Images
To process many image folders at once:
Load multiple folders using Load Images
All folders appear in the list on the left
Set your optimal thresholds
Check Use Current UI Settings
Click Batch Processing
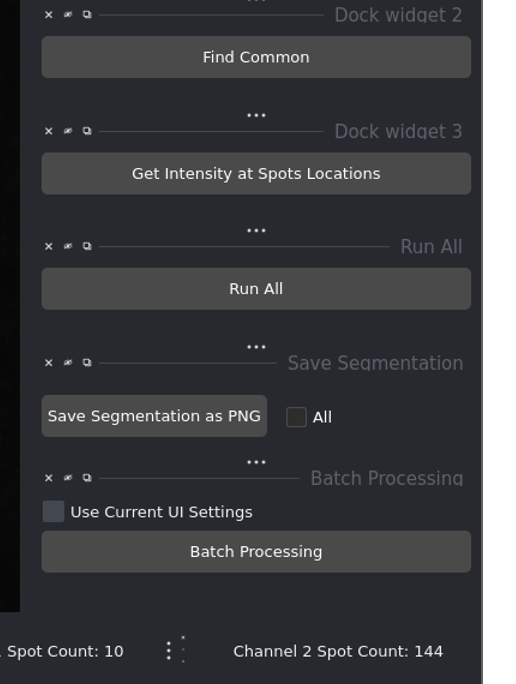
Batch processing interface for analyzing multiple image sets.
Results will be saved for each folder, plus a combined summary file.
Understanding the Interface
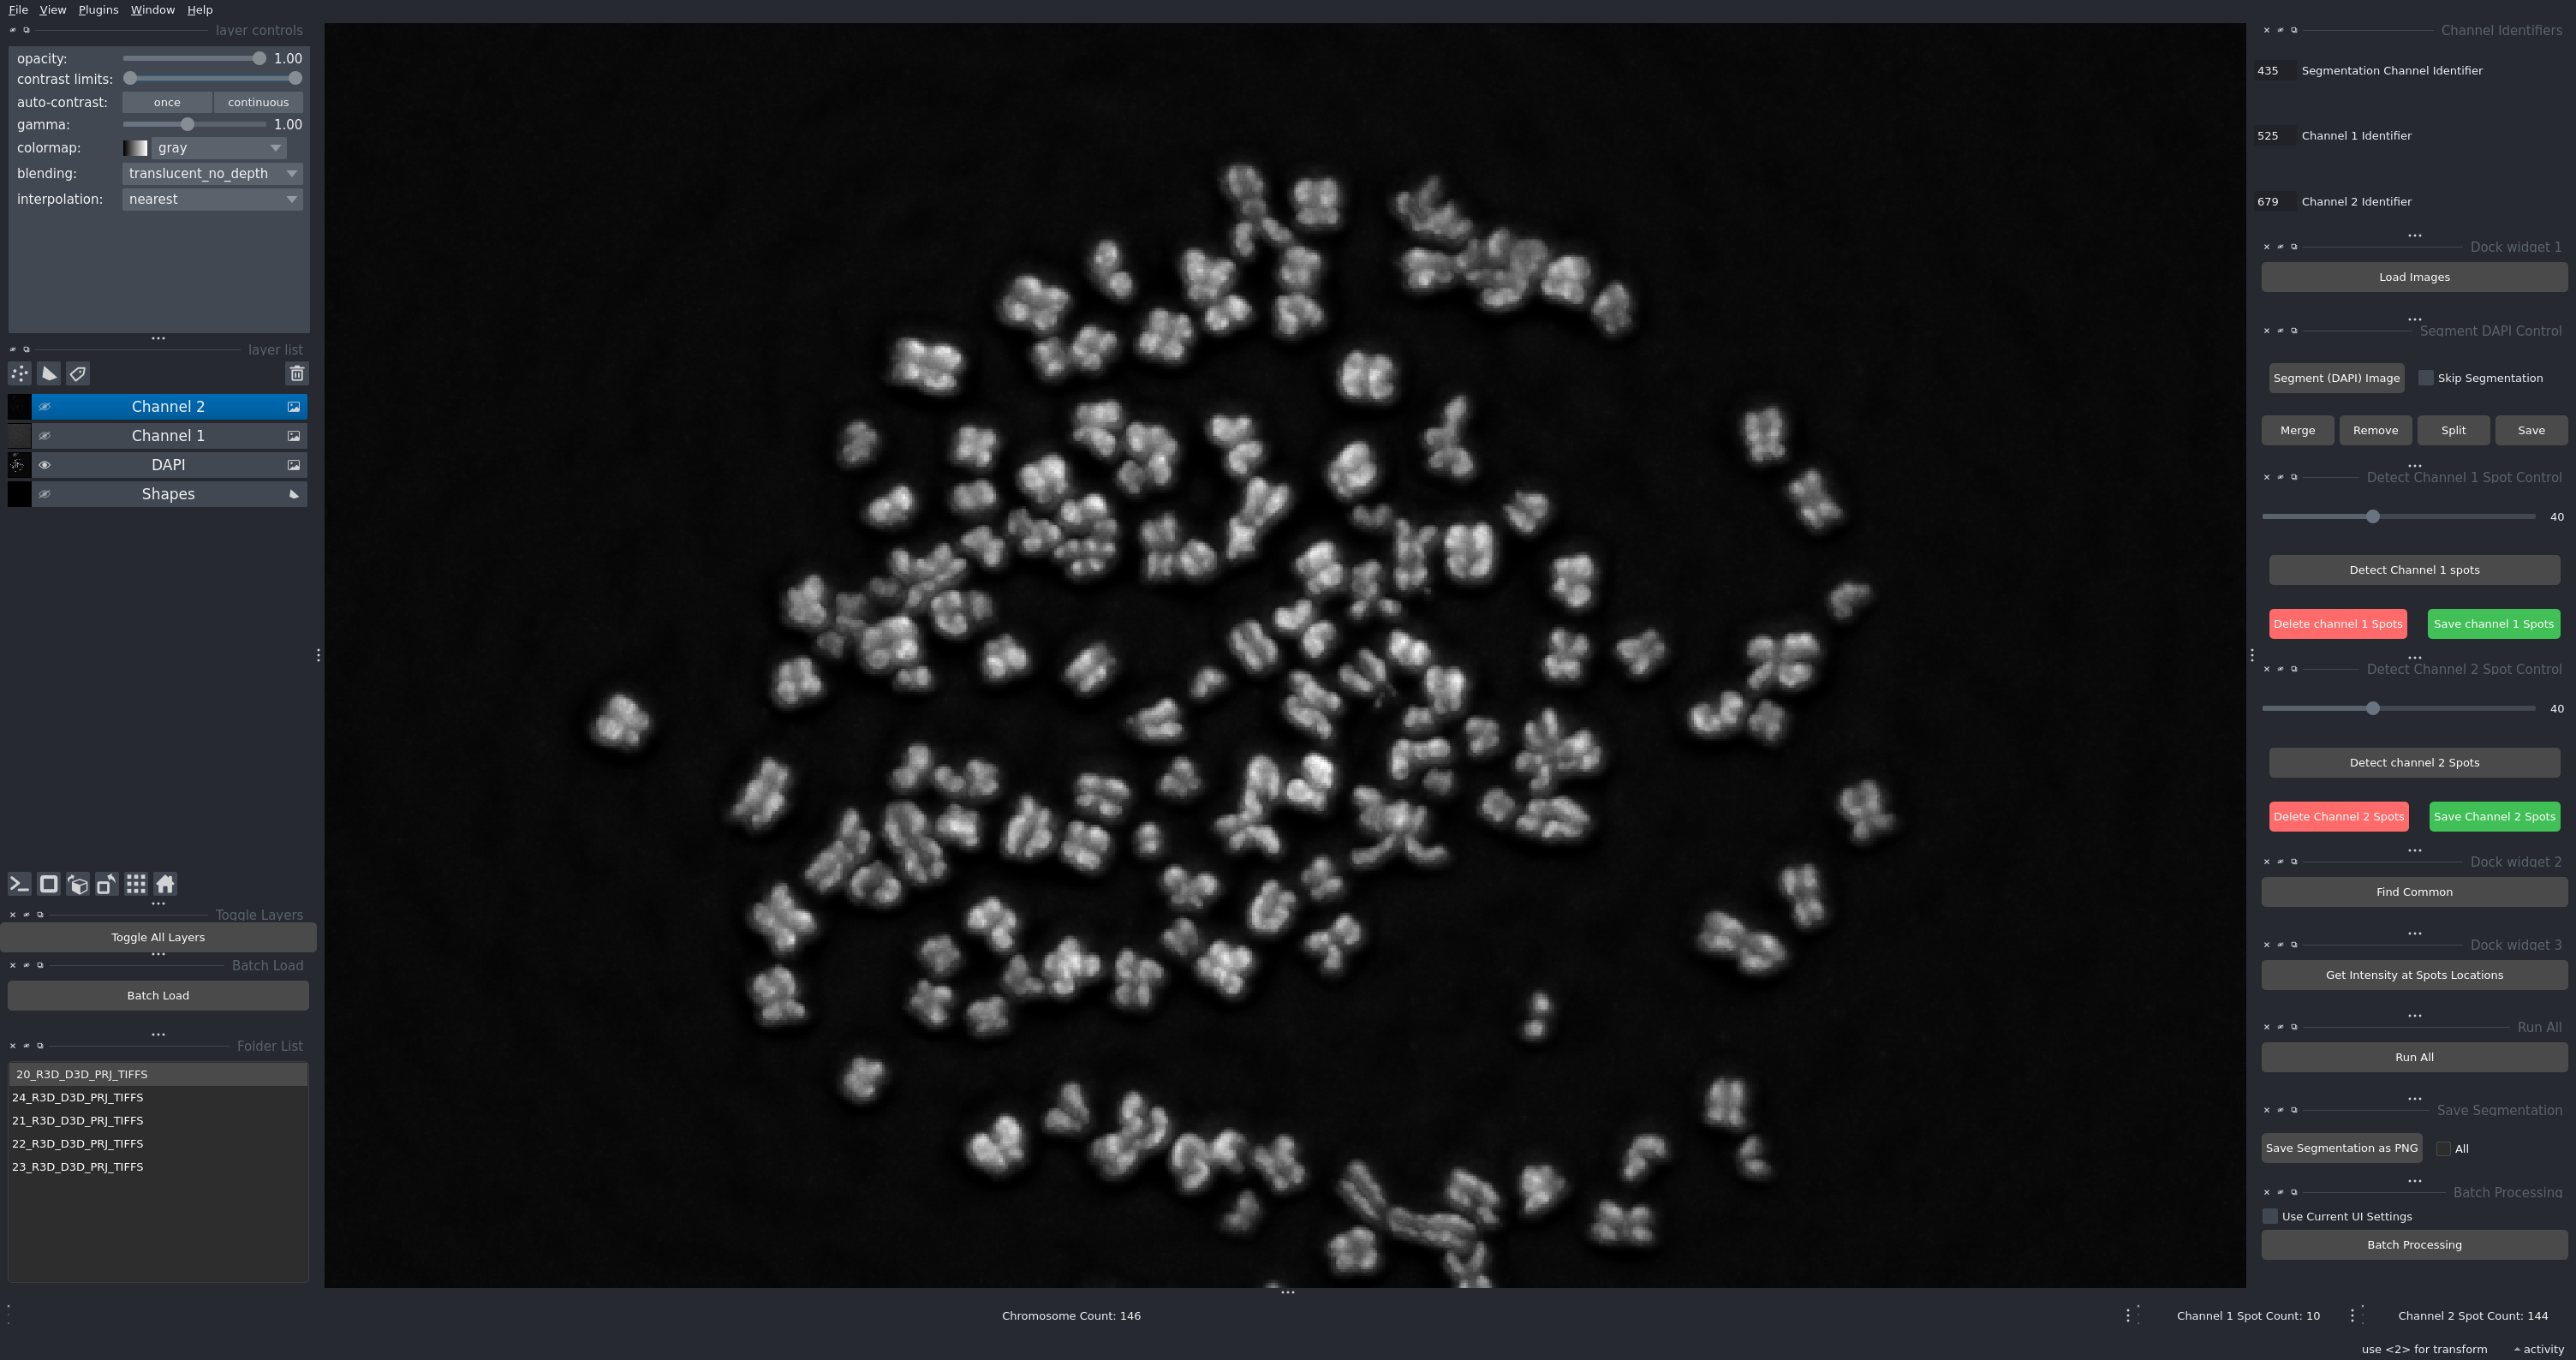
The main interface showing all control panels.
Key Components:
Left panel: Folder list and loaded image layers
Right panel: Control widgets and buttons
Center: Napari viewer displaying your images
Top toolbar: Napari tools for zooming, panning, and drawing
Viewing Your Data
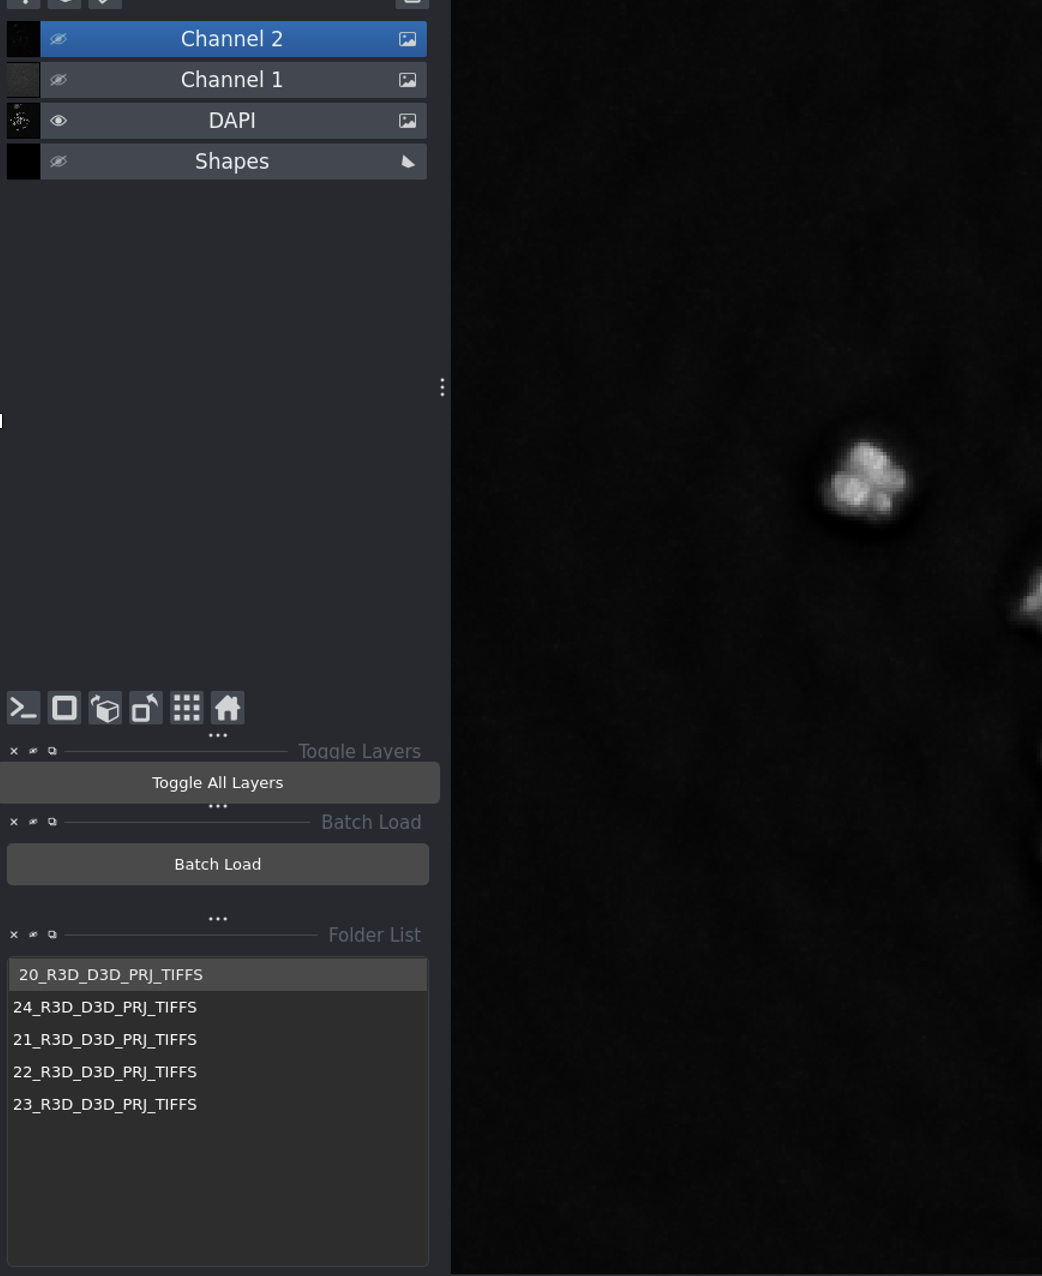
Layer visibility controls - click the eye icon to show/hide channels.
Click the eye icon to toggle layer visibility
Adjust contrast and brightness for each layer
Use Toggle All Layers to show/hide everything at once
Manual Corrections (Optional)
Merging Chromosomes
If two chromosome regions should be one:
Select the Shapes layer
Draw a line connecting the regions
Click Merge Chromosomes
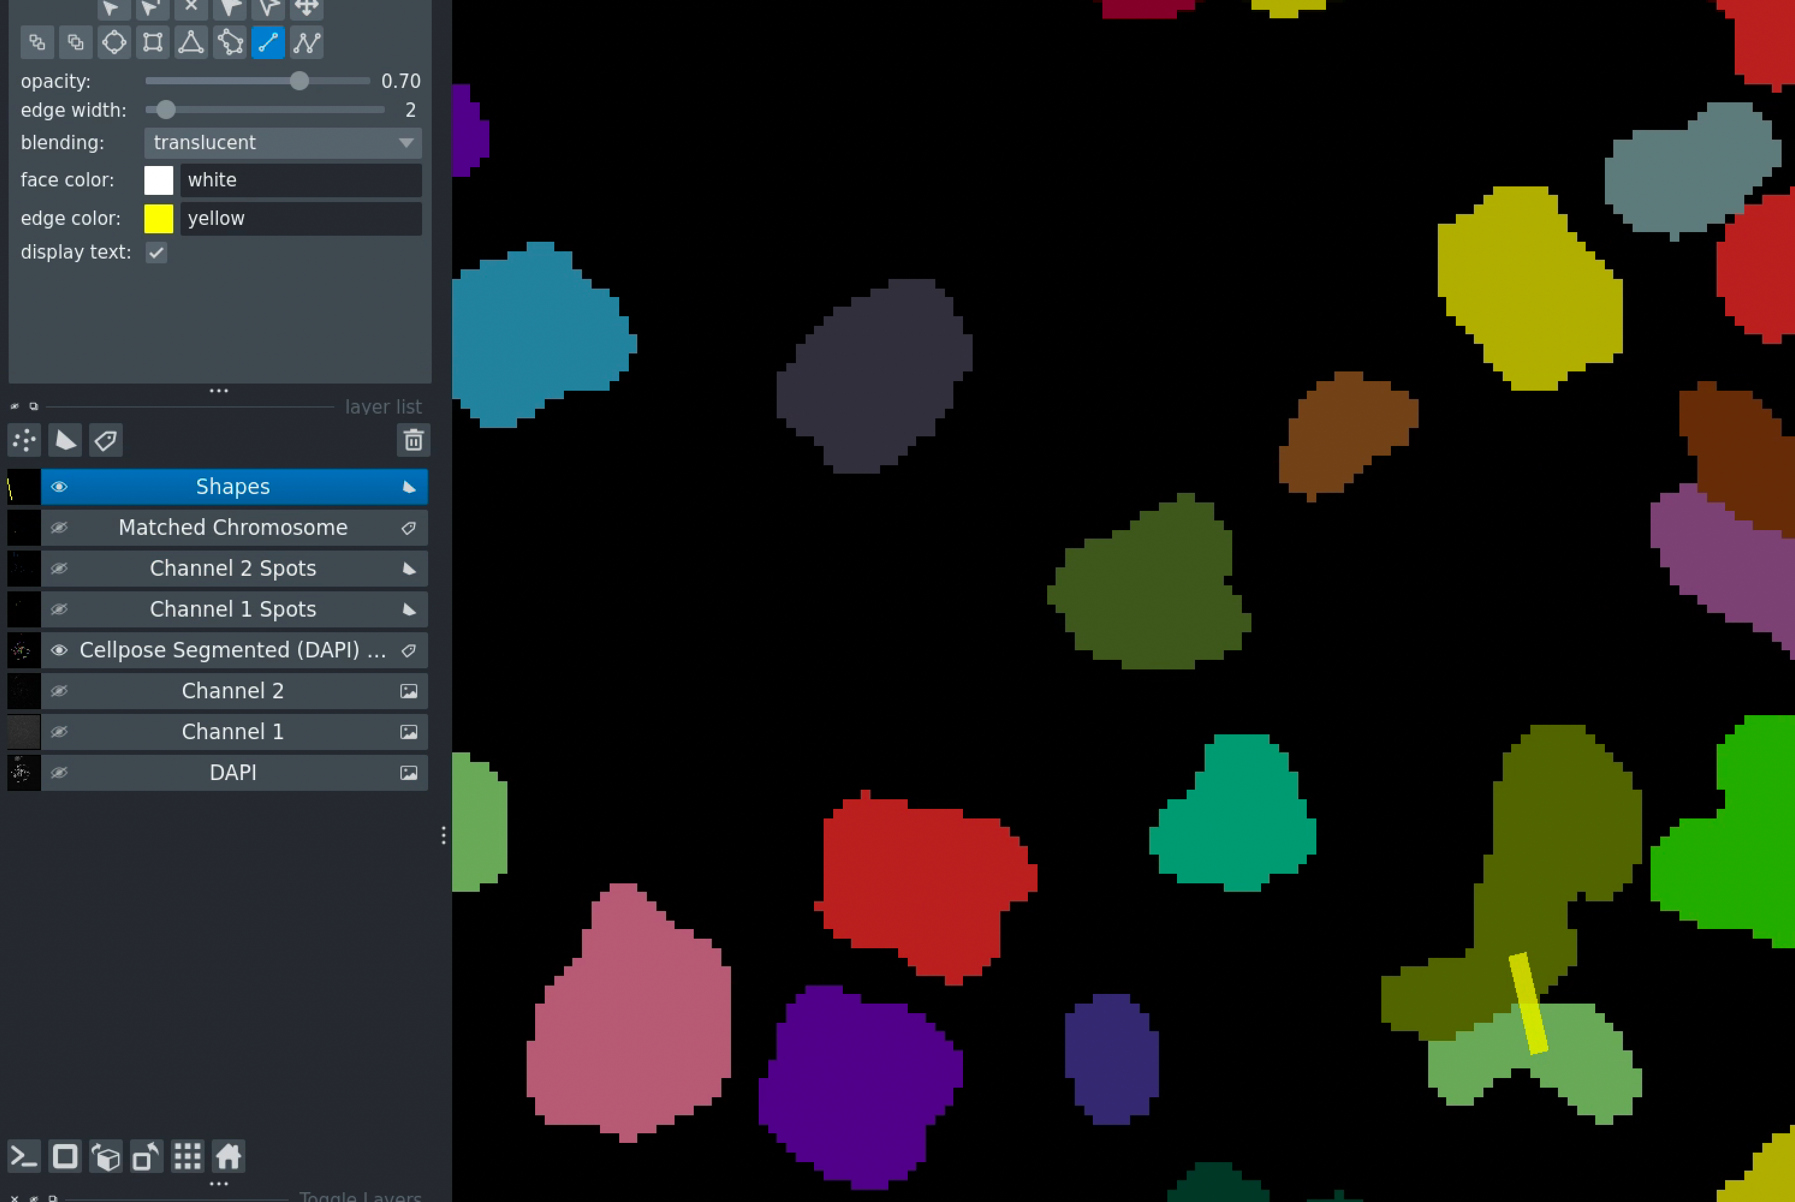
Merging chromosomes - draw a line to connect regions that should be merged.
Removing Chromosomes
To delete unwanted chromosomes:
Select the Shapes layer
Draw a line through the chromosome
Click Remove

Removing chromosomes - draw over regions to mark for deletion.
Don’t forget to click Save after making manual corrections!
Example Workflow Summary
Single Image Analysis:
Configure channels → Load images → Segment → Detect spots →
Find common → Get intensities → Save
Batch Processing:
Configure channels → Load all folders → Set thresholds →
Batch Processing → Results saved automatically
With Manual Corrections:
Follow single image workflow → Make corrections → Save →
Continue with next image
Tips for Best Results
Threshold Adjustment:
Start with mid-range values (around 50)
Lower threshold = more spots detected (more sensitive)
Higher threshold = fewer spots (more specific)
Optimize on a test image before batch processing
Image Quality:
Use well-focused images with good contrast
Ensure consistent imaging parameters across samples
Check that all three channels are properly aligned
Consistent Naming:
Use the same identifier pattern for all images
Example:
sample001_435.tif,sample001_525.tif,sample001_679.tifIdentifiers can appear anywhere in the filename
Performance:
Enable GPU for faster Cellpose segmentation
Process similar images in batches
Close other applications if memory is limited
Common Issues
No spots detected:
Lower the detection threshold
Check that images are properly loaded
Verify channel identifiers match your filenames
Too many false positives:
Increase the detection threshold
Check image quality and background
Segmentation errors:
Verify DAPI image quality
Use manual correction tools
Check that chromosomes are well-separated
Images won’t load:
Verify file naming matches your identifiers
Check that files are in supported formats (TIFF, PNG, JPG)
Ensure all three channels are present (or use Skip Segmentation)
Next Steps
Read the complete User Guide for detailed feature descriptions
Check the API Documentation documentation for programmatic usage
Review Installation for GPU setup and optimization
Need Help?
Contact: sagarm2@nih.gov (HITIF/LRBGE/CCR/NCI)