Basic Workflow
This guide covers the complete single-image analysis workflow with all options and parameters.
Workflow Overview
The basic workflow consists of seven main steps:
Configure channel identifiers
Load images
Segment chromosomes (optional)
Detect spots in both channels
Find common regions
Measure intensities
Export results
Each step is detailed below with all available options.
Step 1: Channel Identifier Configuration
Before loading images, configure the channel identifiers to match your naming convention.
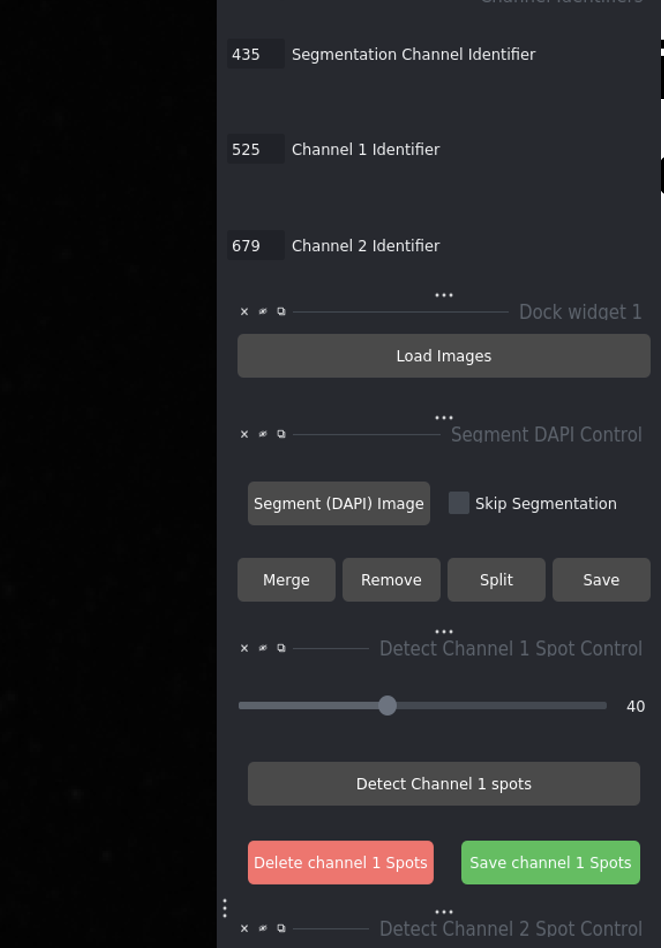
Channel identifier configuration panel
Configuration Fields:
- DAPI Channel Identifier
Enter the string that identifies DAPI images in your filenames.
Examples:
435,dapi,DAPI,w435Used for: Chromosome segmentation
- Channel 1 Identifier (DNA-FISH)
Enter the string that identifies DNA-FISH images.
Examples:
525,dna_fish,DNA-FISH,w525Used for: Primary spot detection
- Channel 2 Identifier (CENP-C)
Enter the string that identifies CENP-C images.
Examples:
679,cenpc,CENP-C,w679Used for: Secondary spot detection
File Naming Examples:
Match these patterns:
``` # Numeric identifiers sample_001_w435.tif (DAPI) sample_001_w525.tif (DNA-FISH) sample_001_w679.tif (CENP-C)
# Descriptive identifiers cell_01_dapi.tif cell_01_dna_fish.tif cell_01_cenpc.tif
# Mixed format image_435_ch1.tif image_525_ch2.tif image_679_ch3.tif ```
Note
The identifier can appear anywhere in the filename. The software searches for the substring within each filename.
Step 2: Loading Images
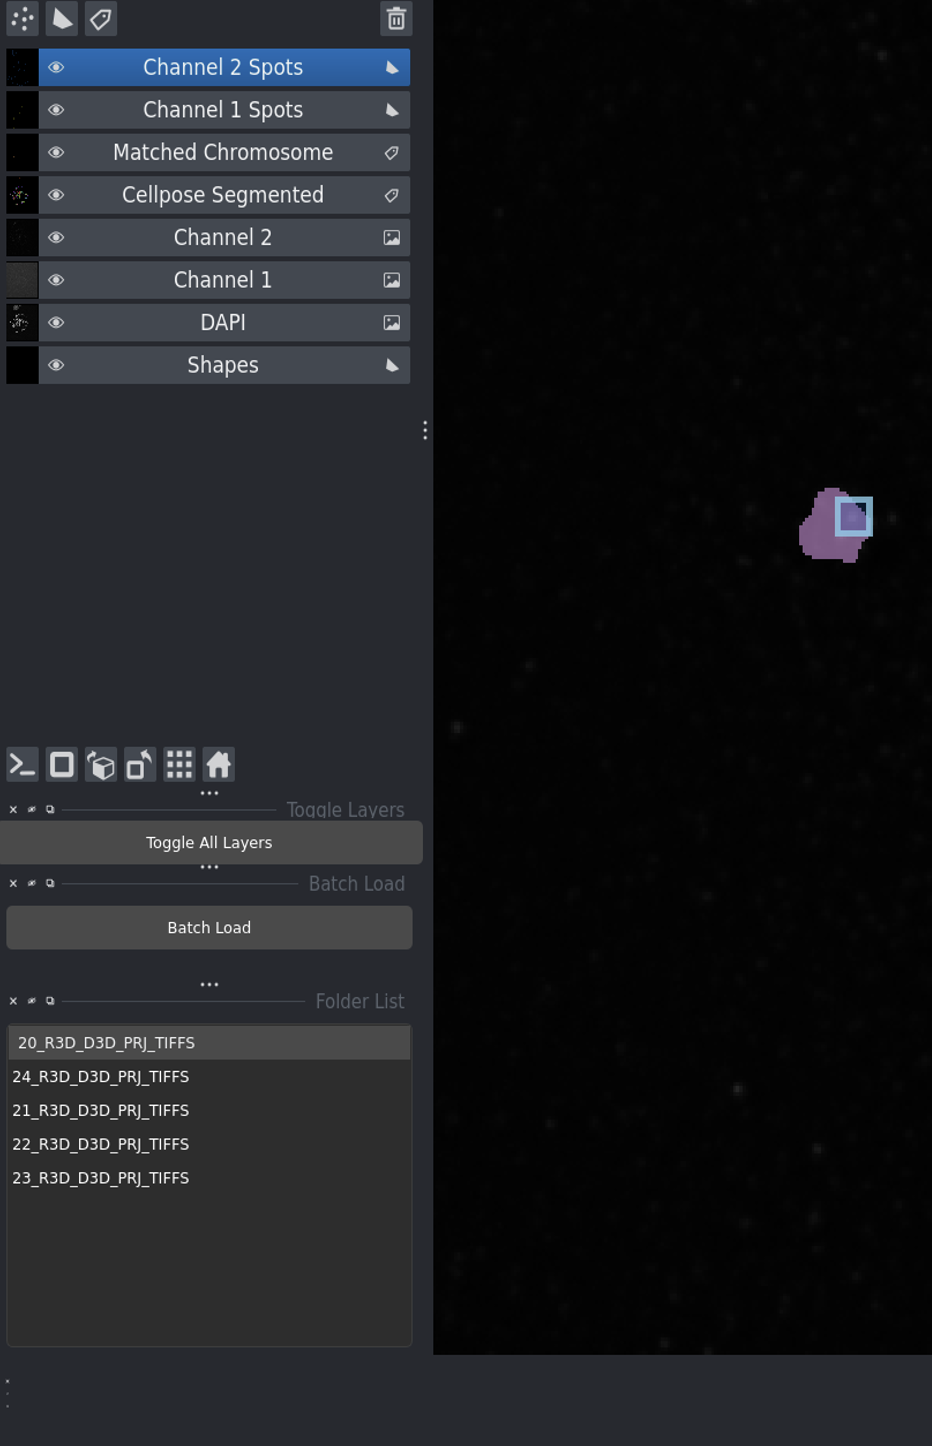
After loading images - folder list appears on the left
To Load Images:
Click the Load Images button
Navigate to your folder containing image files
Click Select
What Happens:
Software searches for files matching your channel identifiers
Matching images are loaded into the napari viewer
Image sets appear in the folder list (left panel)
Click any folder in the list to switch between image sets
Skip Segmentation Option:
Tip
Check Skip Segmentation before loading if:
You don’t have DAPI images
You only want to analyze spot co-localization
Segmentation is not needed for your analysis
When checked, the software skips Step 3 and goes directly to spot detection.
Step 3: Chromosome Segmentation
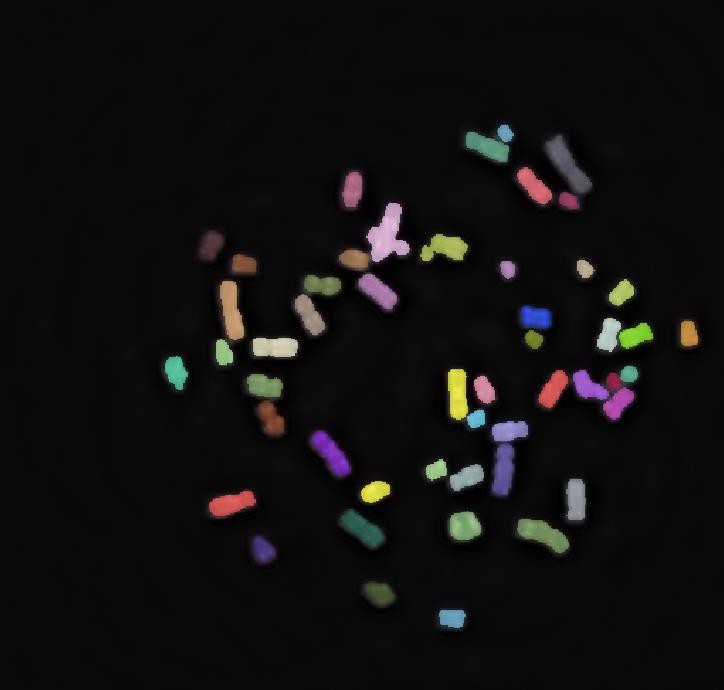
Segmentation output showing individual chromosomes with unique labels
To Segment:
Click Segment (DAPI) Image
Processing:
Uses trained Cellpose model for metaphase chromosomes
Automatically detects chromosome boundaries
Creates a labels layer with unique ID for each chromosome
Each chromosome is displayed in a different color
Segmentation Parameters:
The Cellpose model uses these default parameters:
Model: Custom trained for metaphase chromosomes
Diameter: Automatically determined
Channels: [0,0] for grayscale DAPI
GPU: Enabled if available
Post-processing Options:
Available through checkboxes (if implemented):
Remove small objects: Filters out noise
Remove edge objects: Excludes chromosomes touching borders
Fill holes: Fills gaps within chromosomes
Smooth boundaries: Applies morphological smoothing
Typical Processing Time:
With GPU: 5-15 seconds
Without GPU: 30-60 seconds
Step 4: Spot Detection
Detect spots in both channels using adjustable thresholds.
Adjusting Thresholds
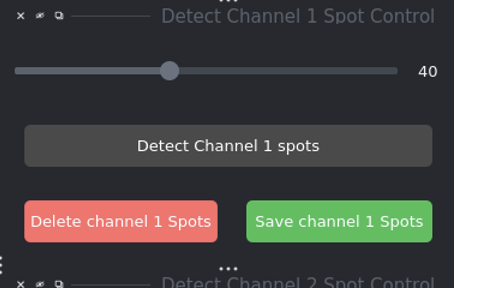
Threshold adjustment controls
DNA-FISH Threshold Slider:
Range: 0-100
Default: 50
Lower values = more spots detected (more sensitive)
Higher values = fewer spots detected (more specific)
CENP-C Threshold Slider:
Same range and behavior as DNA-FISH
Independently adjustable
Optimize based on your image quality
Important
Changing the slider resets detection status. You must re-run detection after adjusting thresholds.
Detecting Channel 1 Spots
Adjust the DNA-FISH Threshold slider
Click Detect Channel 1 Spots
Wait for processing to complete
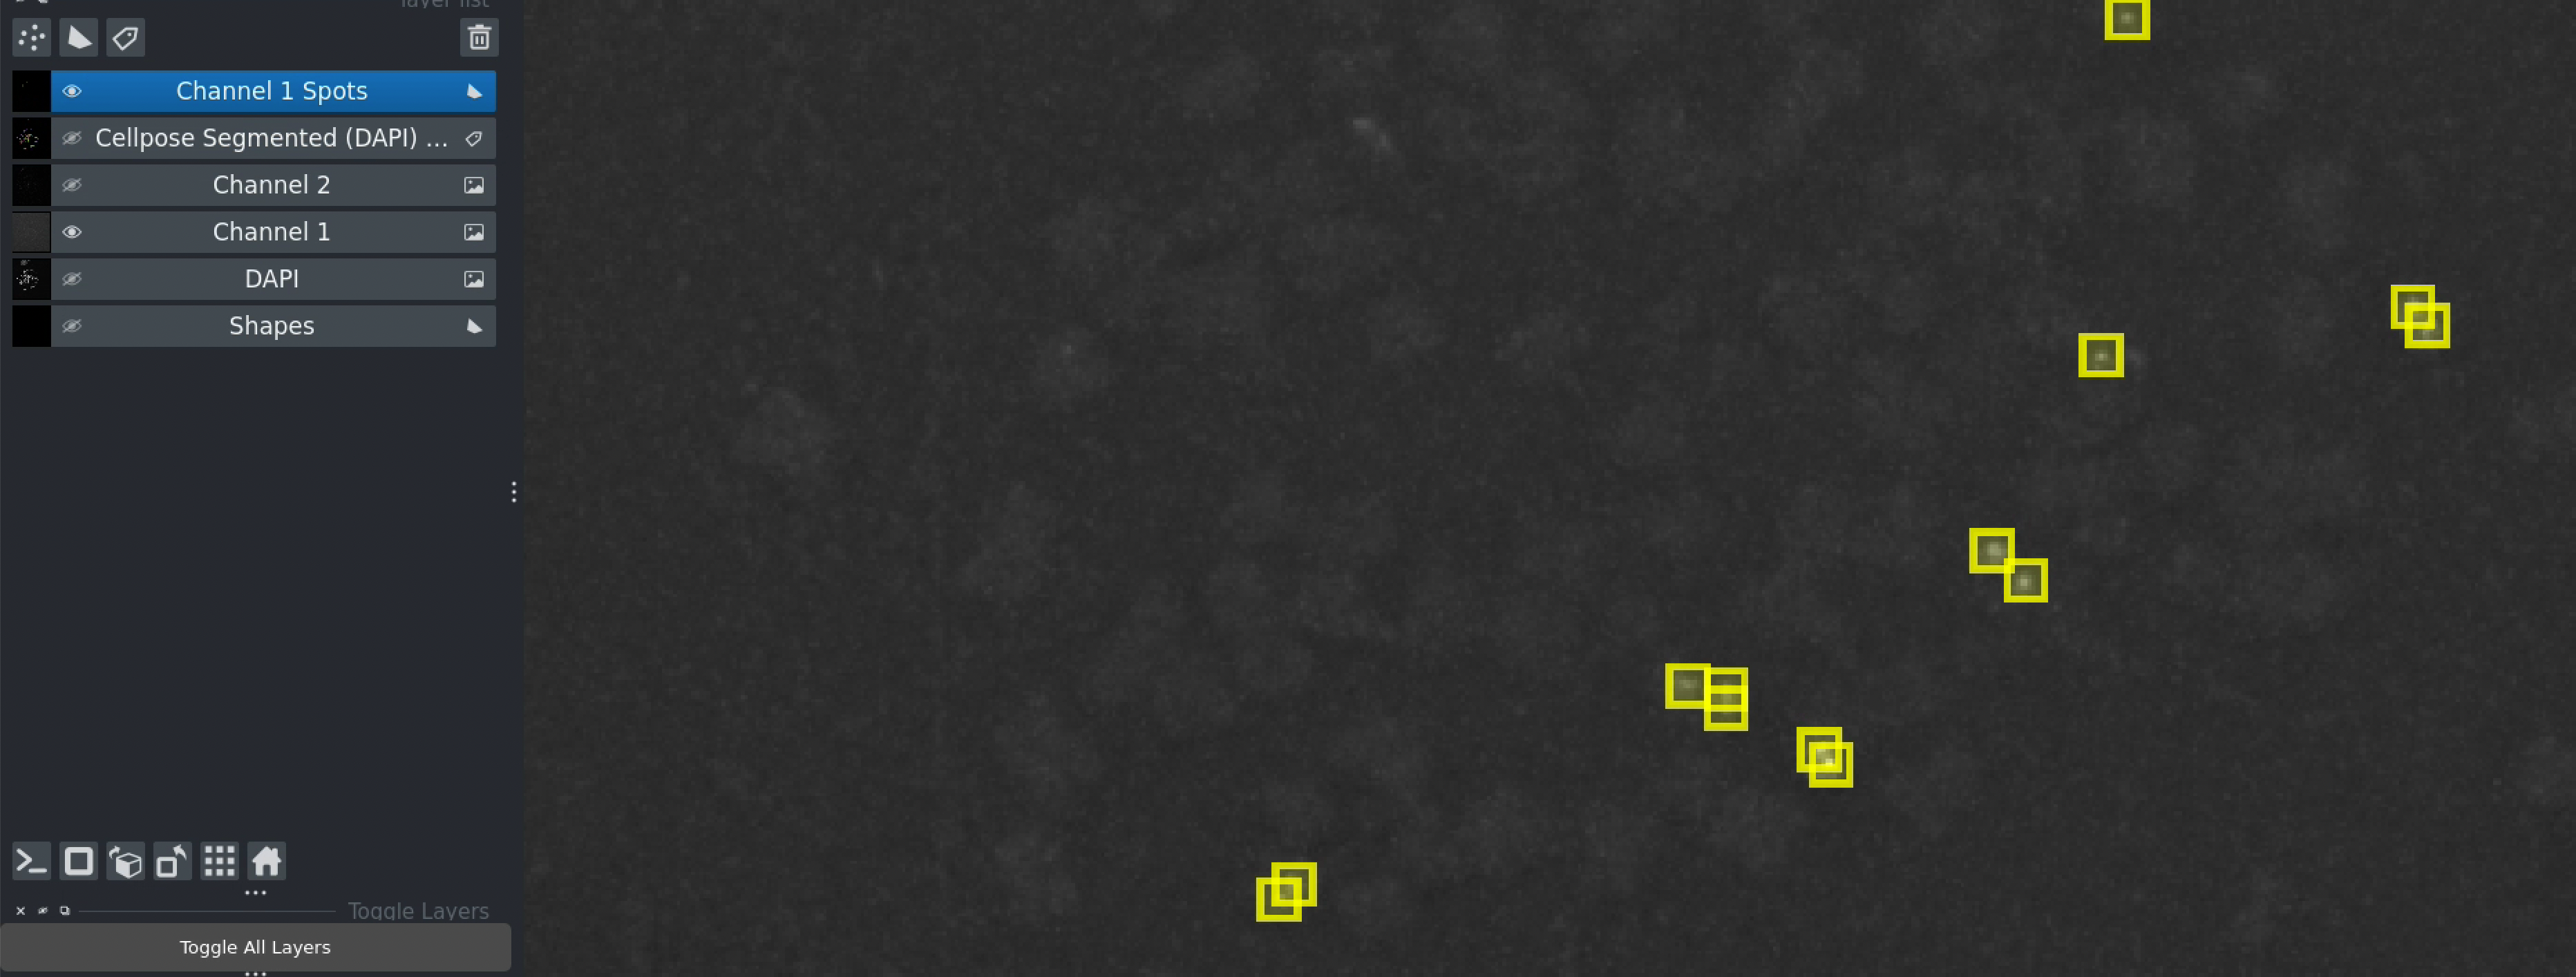
Channel 1 spots detected - shown as brown markers
What You’ll See:
New layer: “Channel 1 spots”
Colored markers at each detected spot location
Toggle the DNA-FISH layer to see overlay
Detecting Channel 2 Spots
Adjust the CENP-C Threshold slider
Click Detect Channel 2 Spots
Wait for processing
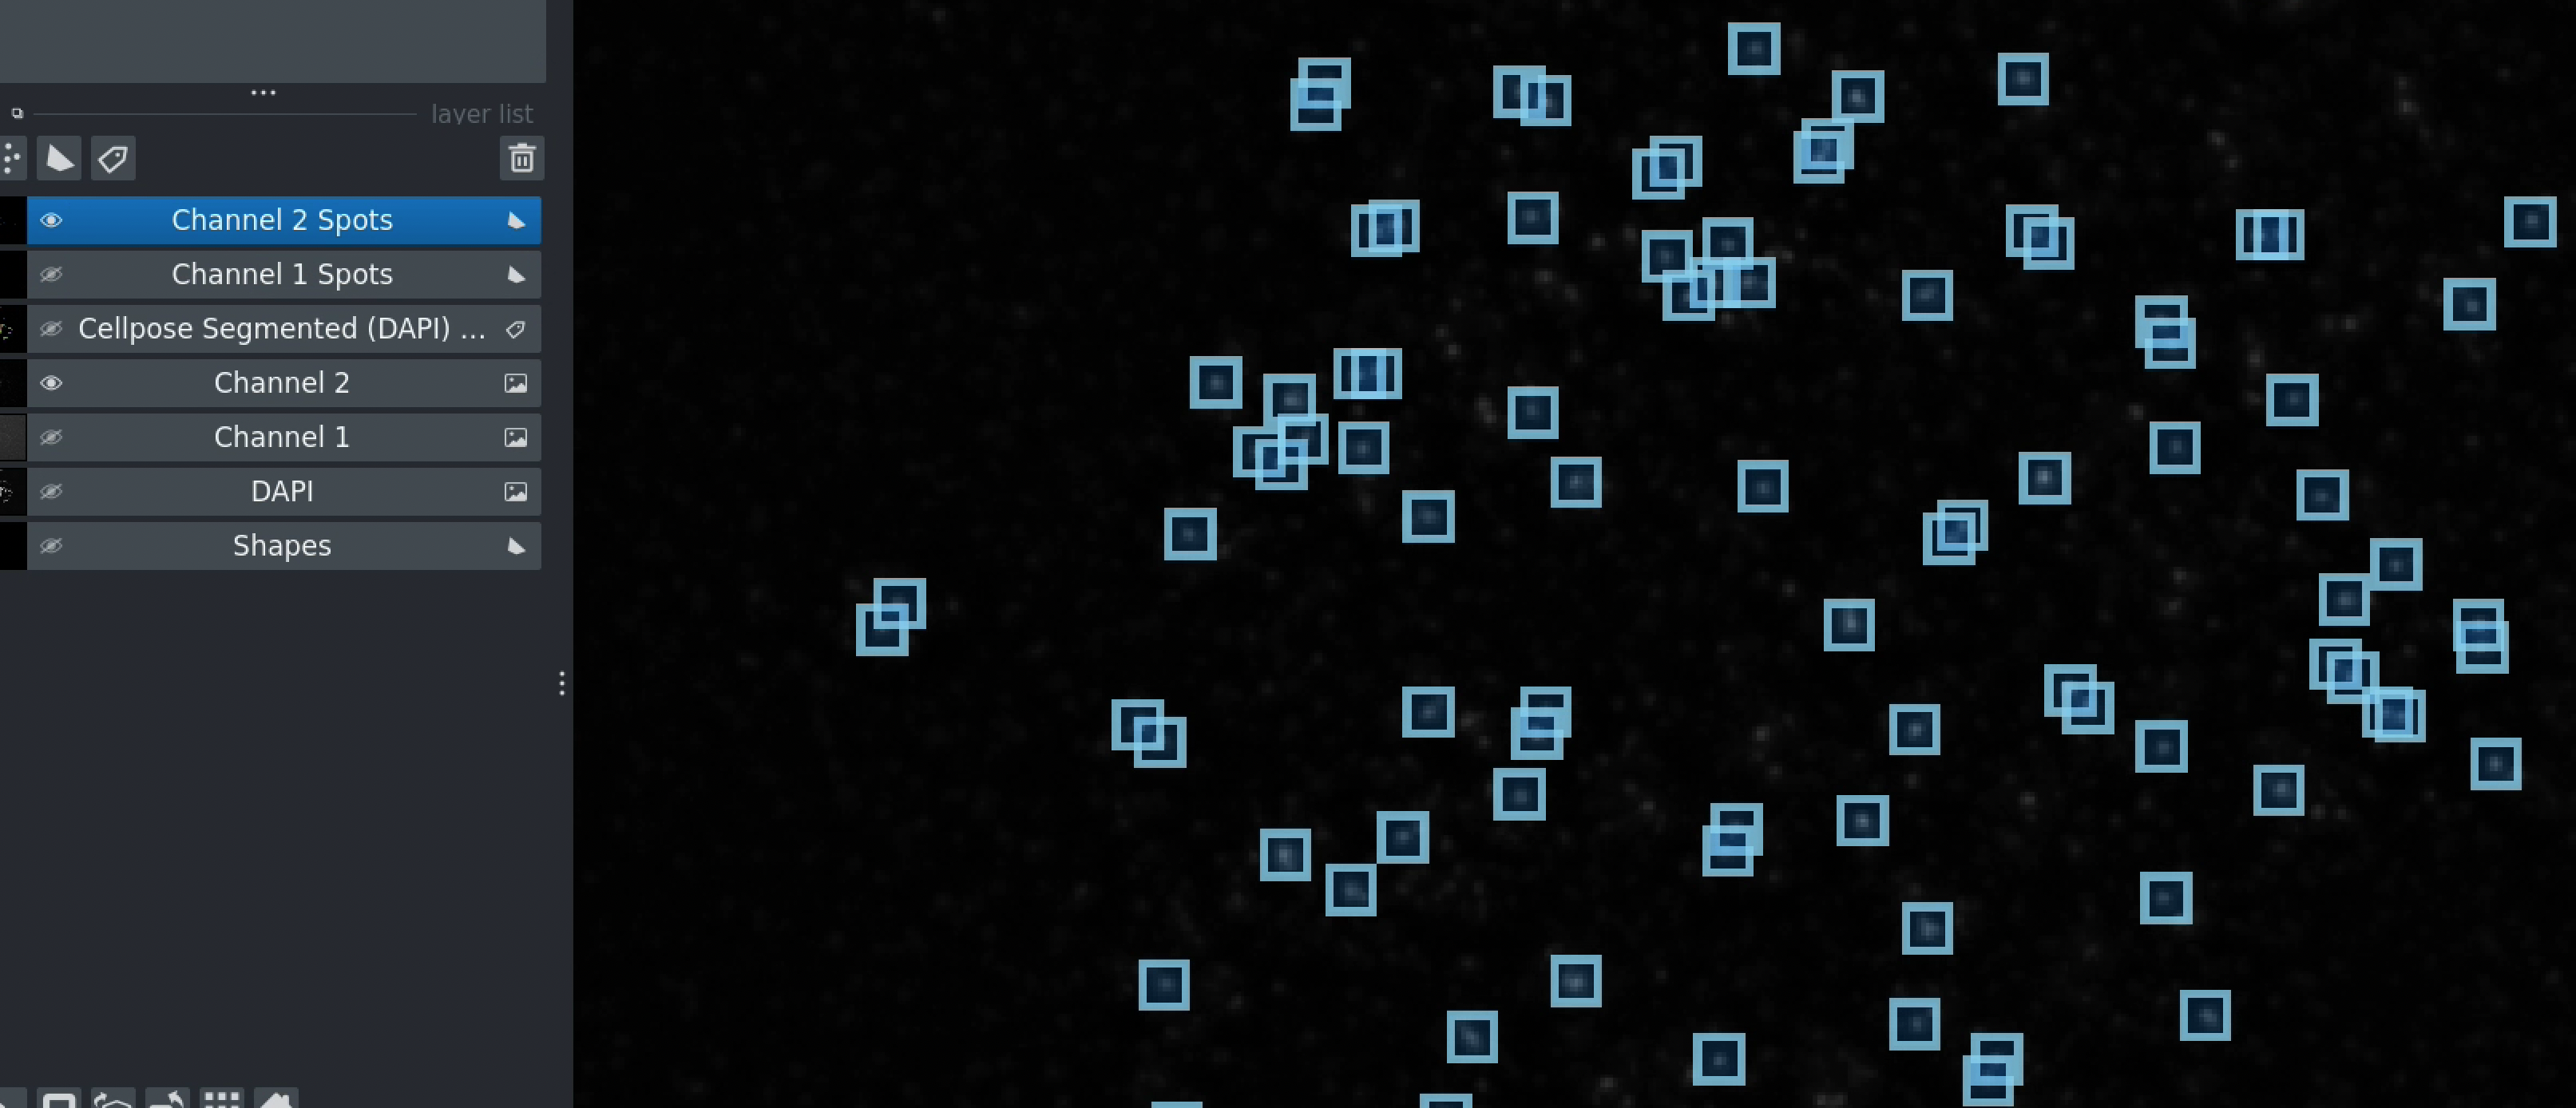
Both channels with detected spots
Optimization Tips:
Start with default value (50)
If too few spots: decrease threshold by 10
If too many false positives: increase threshold by 10
Test on a representative image before batch processing
Step 5: Finding Common Regions
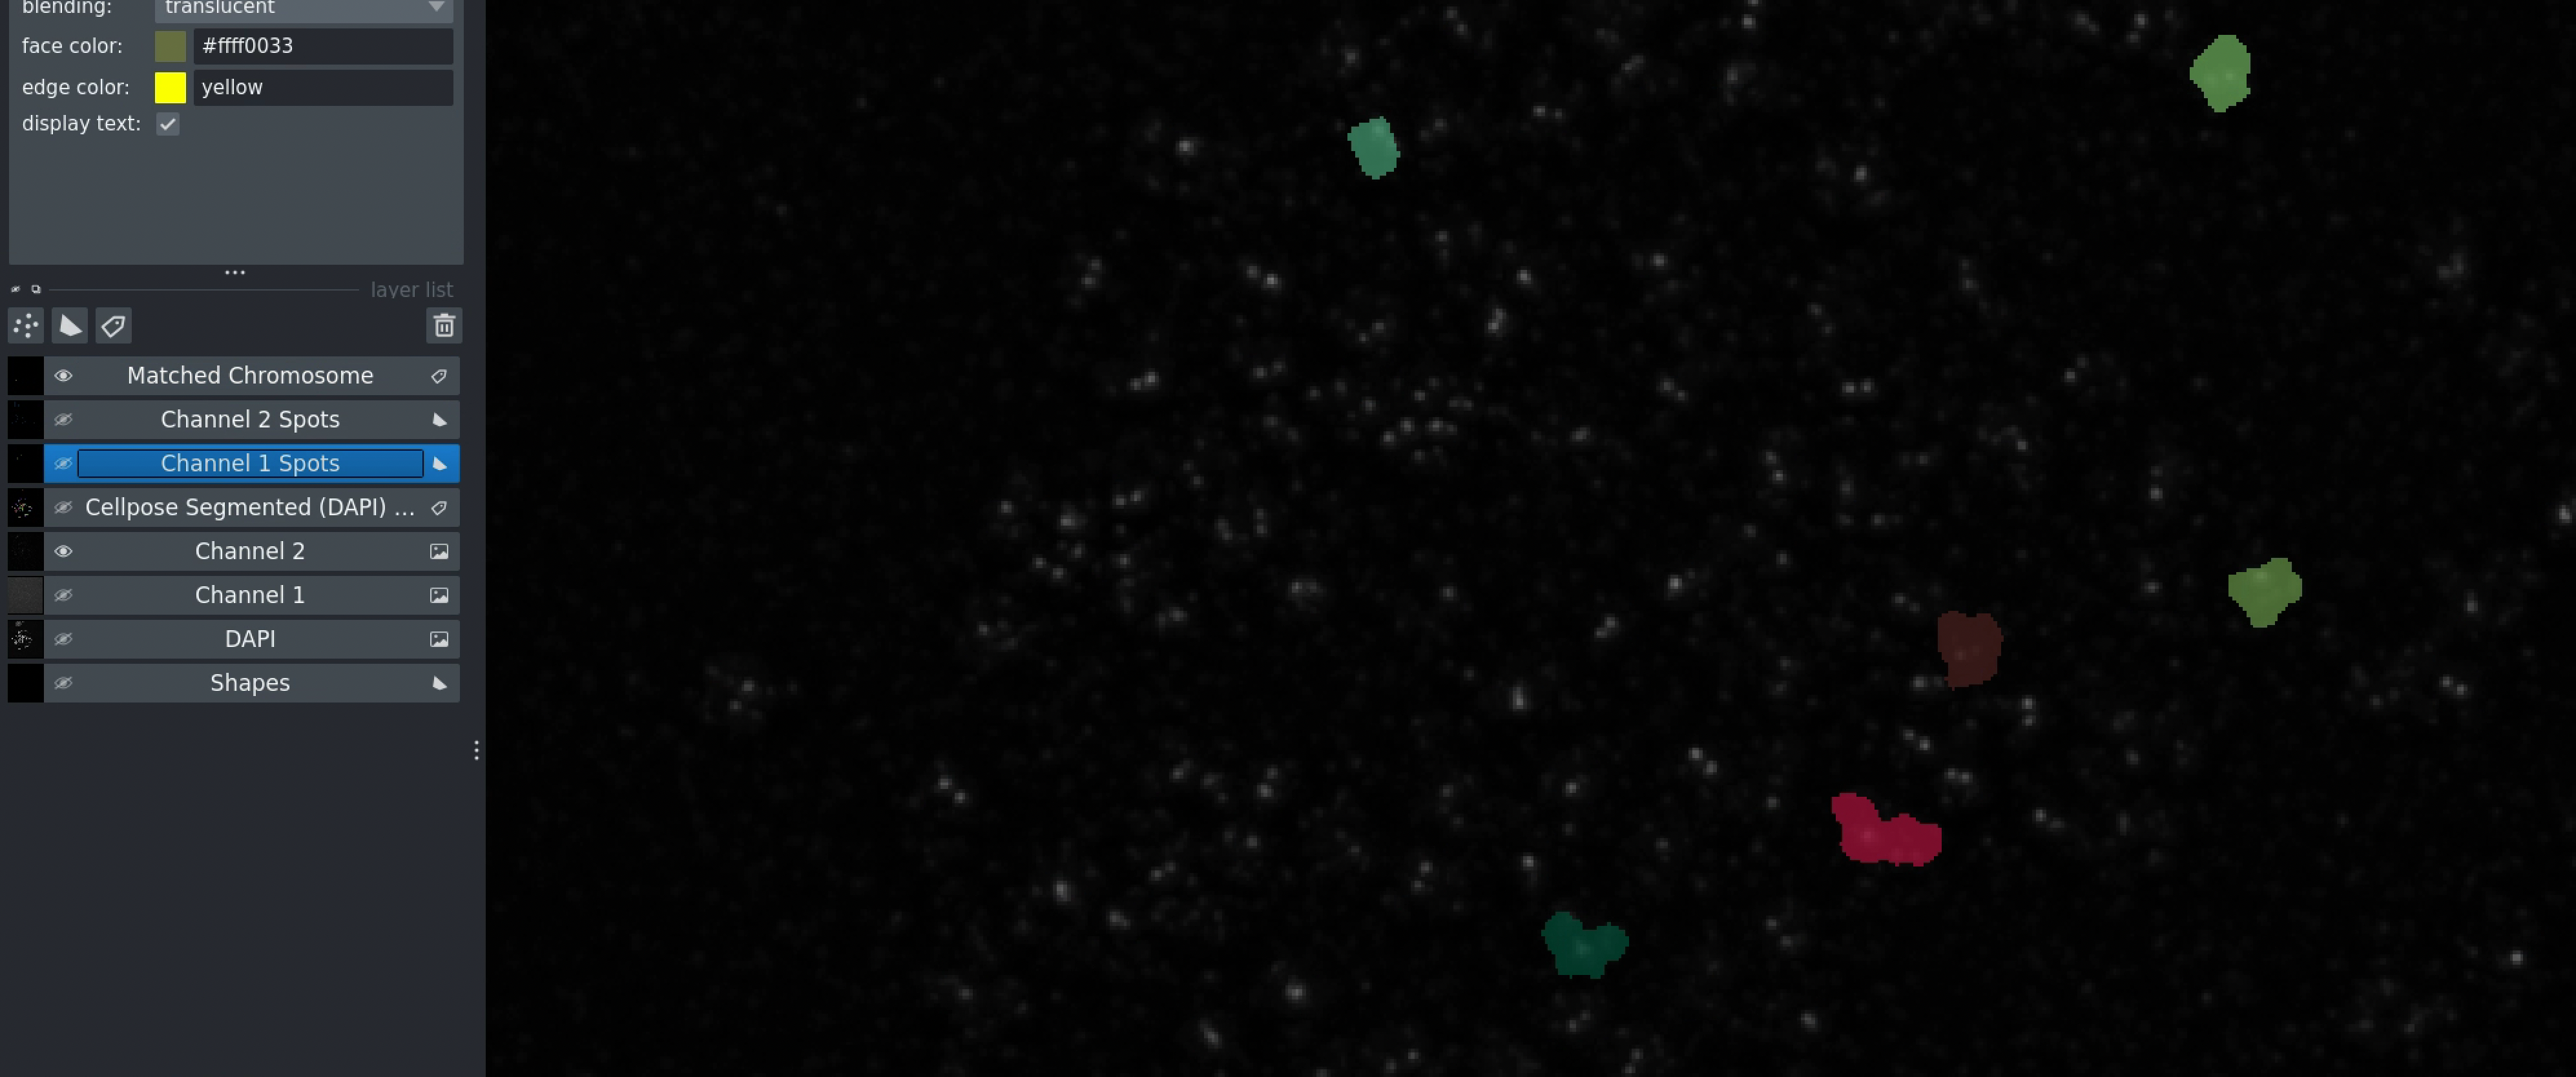
Finding common regions interface
Click Find Common to identify overlapping signals.
What This Does:
Identifies chromosomes (or regions) with both Channel 1 and Channel 2 spots
Creates a filtered dataset of co-localized signals
Removes background and non-overlapping signals
Why It’s Important:
Ensures meaningful co-localization
Reduces false positives
Improves quantification accuracy
Output:
New layer showing common regions
Only spots in common regions will be used for intensity measurements
Step 6: Measuring Intensities
Click Get Intensity at Spots Location
Measurements Performed:
Channel 2 intensity at each Channel 1 spot location
Channel 1 intensity at each Channel 2 spot location
Background-subtracted values
Spot coordinates
CSV Output Format:
The saved file contains columns:
spot_id: Unique identifier for each spotx_coordinate: X position in pixelsy_coordinate: Y position in pixelschannel1_intensity: Intensity in Channel 1channel2_intensity: Intensity in Channel 2folder_name: Source folderAdditional metadata
File Location:
Saved in the same folder as your images
Filename:
<folder_name>_intensity.csvCheck terminal output for exact path
Step 7: Saving and Exporting
Automatic Saves:
CSV files are automatically saved after intensity calculation
Naming format:
<folder_name>_intensity.csv
Manual Saves:
If you made manual corrections (see Manual Corrections):
Click Save button
Corrections are stored for next time you load this image set
Exporting Visualizations:
To export images with overlays:
In Napari menu: File → Save Selected Layer(s)
Choose format (PNG recommended)
Select layers to export
Analysis Without Segmentation
For spot-only analysis (no chromosome segmentation needed):
When to Use:
No DAPI channel available
Only analyzing spot co-localization
Chromosomes not relevant to your analysis
Setup:
Check Skip Segmentation before loading images
Load only Channel 1 and Channel 2 images
DAPI is ignored even if present
Workflow:
Load images (segmentation is skipped)
Detect Channel 1 spots
Detect Channel 2 spots
Find common regions (based on spatial proximity)
Measure intensities
Differences:
No chromosome boundaries
Spot detection uses entire image
Common regions based on spot proximity, not chromosome overlap
One-Click Analysis: Run All
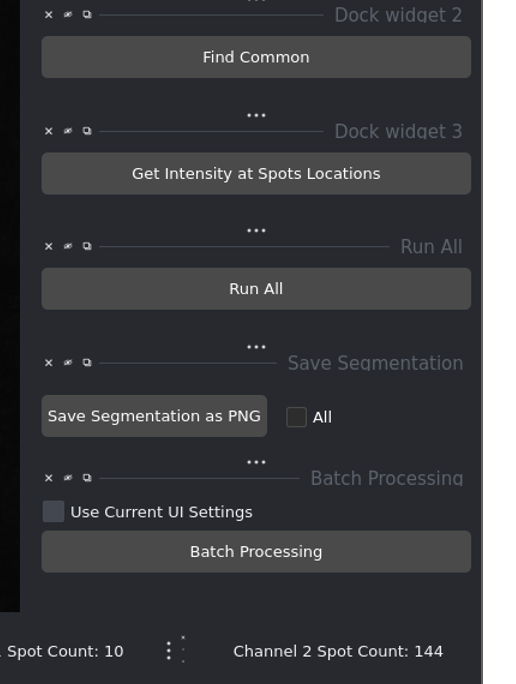
Run All button for automated processing
Once you’ve determined optimal thresholds:
Configure channel identifiers
Load images
Adjust both threshold sliders
Check/uncheck Skip Segmentation as needed
Click Run All
What Happens:
Automatically executes all steps:
Segmentation (if not skipped)
Channel 1 spot detection
Channel 2 spot detection
Find common regions
Calculate intensities
Save results
Use Case:
Perfect for processing additional images with known-good parameters.
Parameters Reference
Channel Identifiers:
DAPI identifier (string)
Channel 1 identifier (string)
Channel 2 identifier (string)
Detection Thresholds:
DNA-FISH threshold (0-100, default: 50)
CENP-C threshold (0-100, default: 50)
Processing Options:
Skip segmentation (checkbox)
Post-processing options (if available)
Output Files:
<folder_name>_intensity.csv: Main results fileOptional: Saved segmentations and spot labels
Best Practices
Parameter Optimization:
Start with default thresholds (50)
Test on 2-3 representative images
Adjust thresholds based on results
Document optimal values for your imaging conditions
Quality Control:
Visually inspect segmentation results
Check spot detection for false positives/negatives
Use manual correction tools when needed
Save corrections for reproducibility
Documentation:
Record optimal threshold values
Note any imaging condition changes
Keep analysis parameters with results
Document manual corrections made
Next Steps
Batch Processing - Process multiple images automatically
Manual Corrections - Refine automated results
Advanced Features - Explore additional features
Troubleshooting - Solutions to common problems