Manual Corrections
Interactive tools for refining automated analysis results.
Overview
While automated segmentation and spot detection are generally accurate, manual correction tools allow you to refine results for maximum accuracy. This is especially important for:
Incorrectly split or merged chromosomes
False positive spots
Ambiguous segmentation boundaries
Quality control and validation
The toolkit provides interactive drawing tools integrated with Napari for intuitive corrections.
Manual Correction Workflow
When to Use Manual Corrections:
✅ Segmentation errors (split/merged chromosomes) ✅ False positive spots ✅ Quality control for critical samples ✅ Publication-quality analysis
Recommended Approach:
Run automated analysis
Review results visually
Apply corrections where needed
Save corrections
Re-run intensity calculations
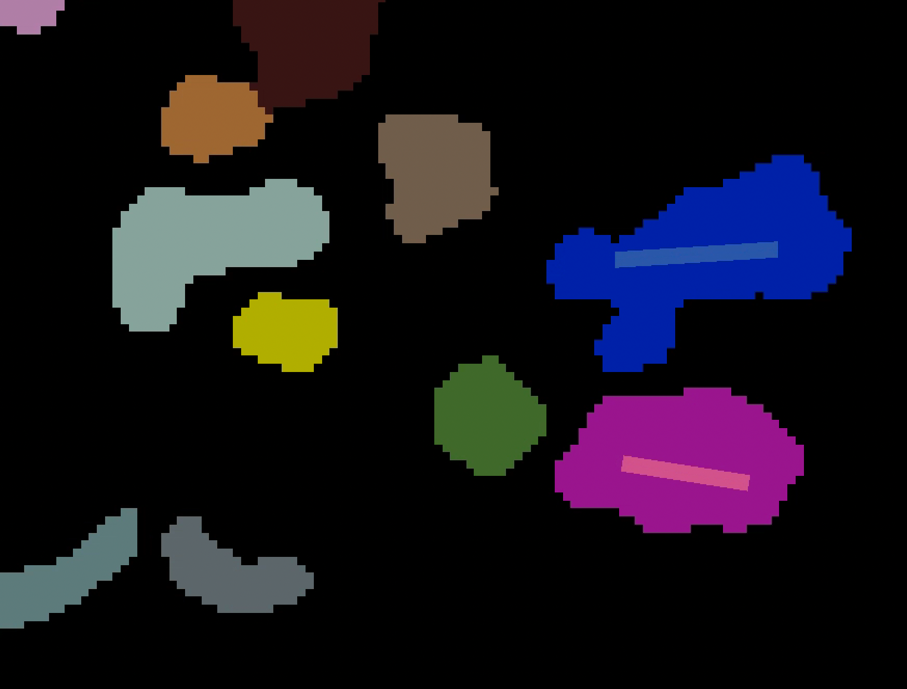
Merging Chromosomes
Use when a single chromosome is incorrectly segmented into multiple regions.
Drawing a line to connect regions that should be merged
Step-by-Step Process
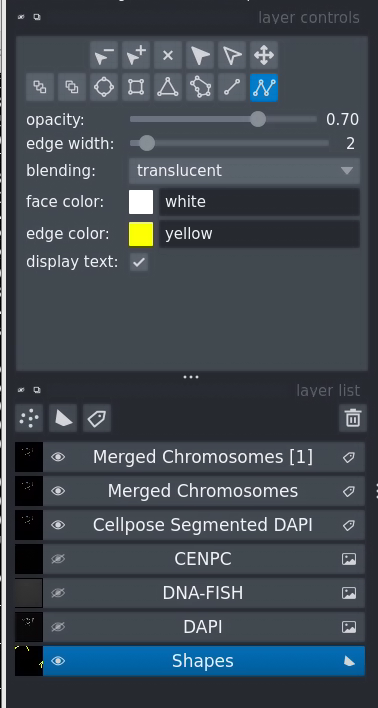
1. Prepare the Workspace
Ensure segmented layer and shapes layer are visible
Make sure the segmented layer is visible (eye icon on)
Make sure the shapes layer is visible
Both layers should be shown simultaneously
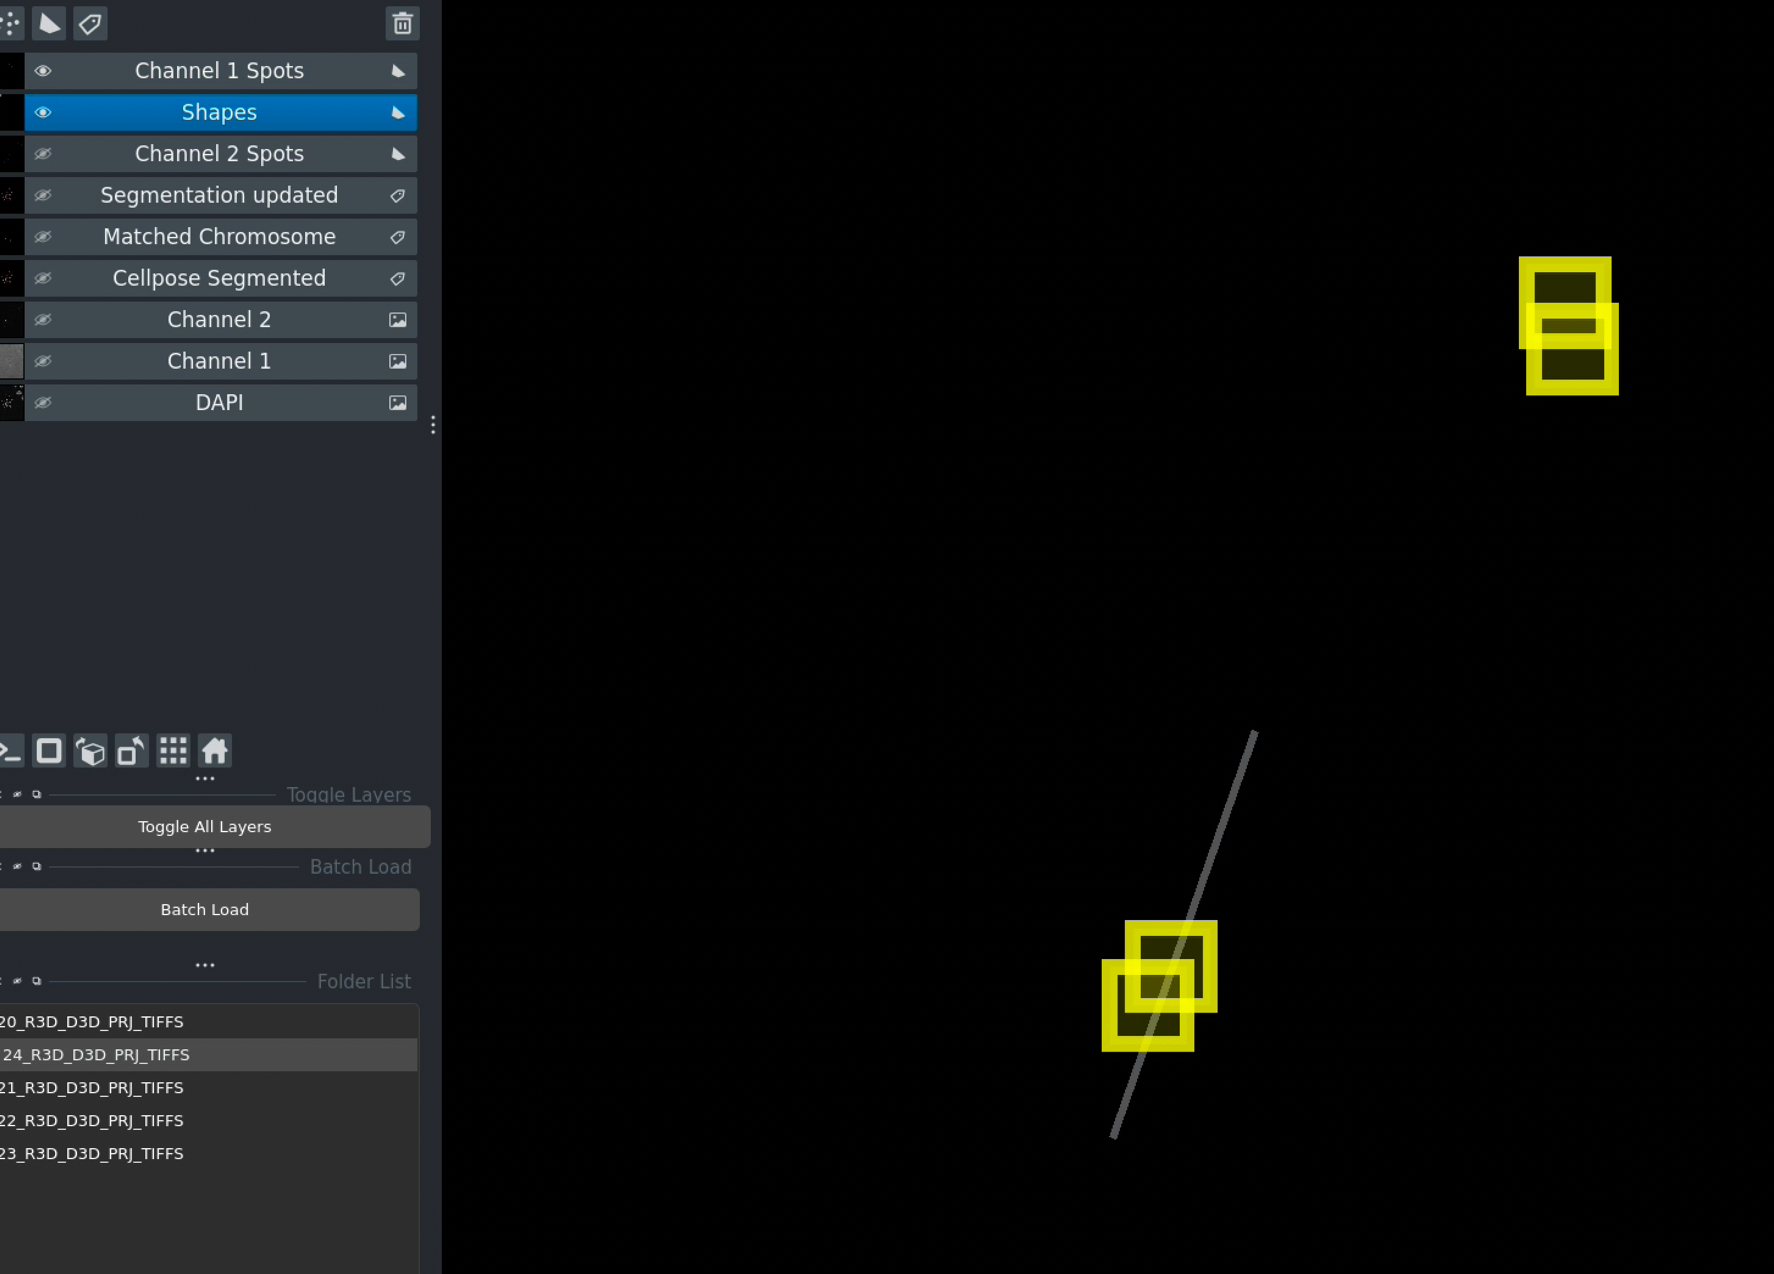
2. Select the Shapes Layer
Select the shapes layer before drawing
Click on the Shapes layer in the layer list
It should be highlighted/selected
This ensures your drawings go to the correct layer
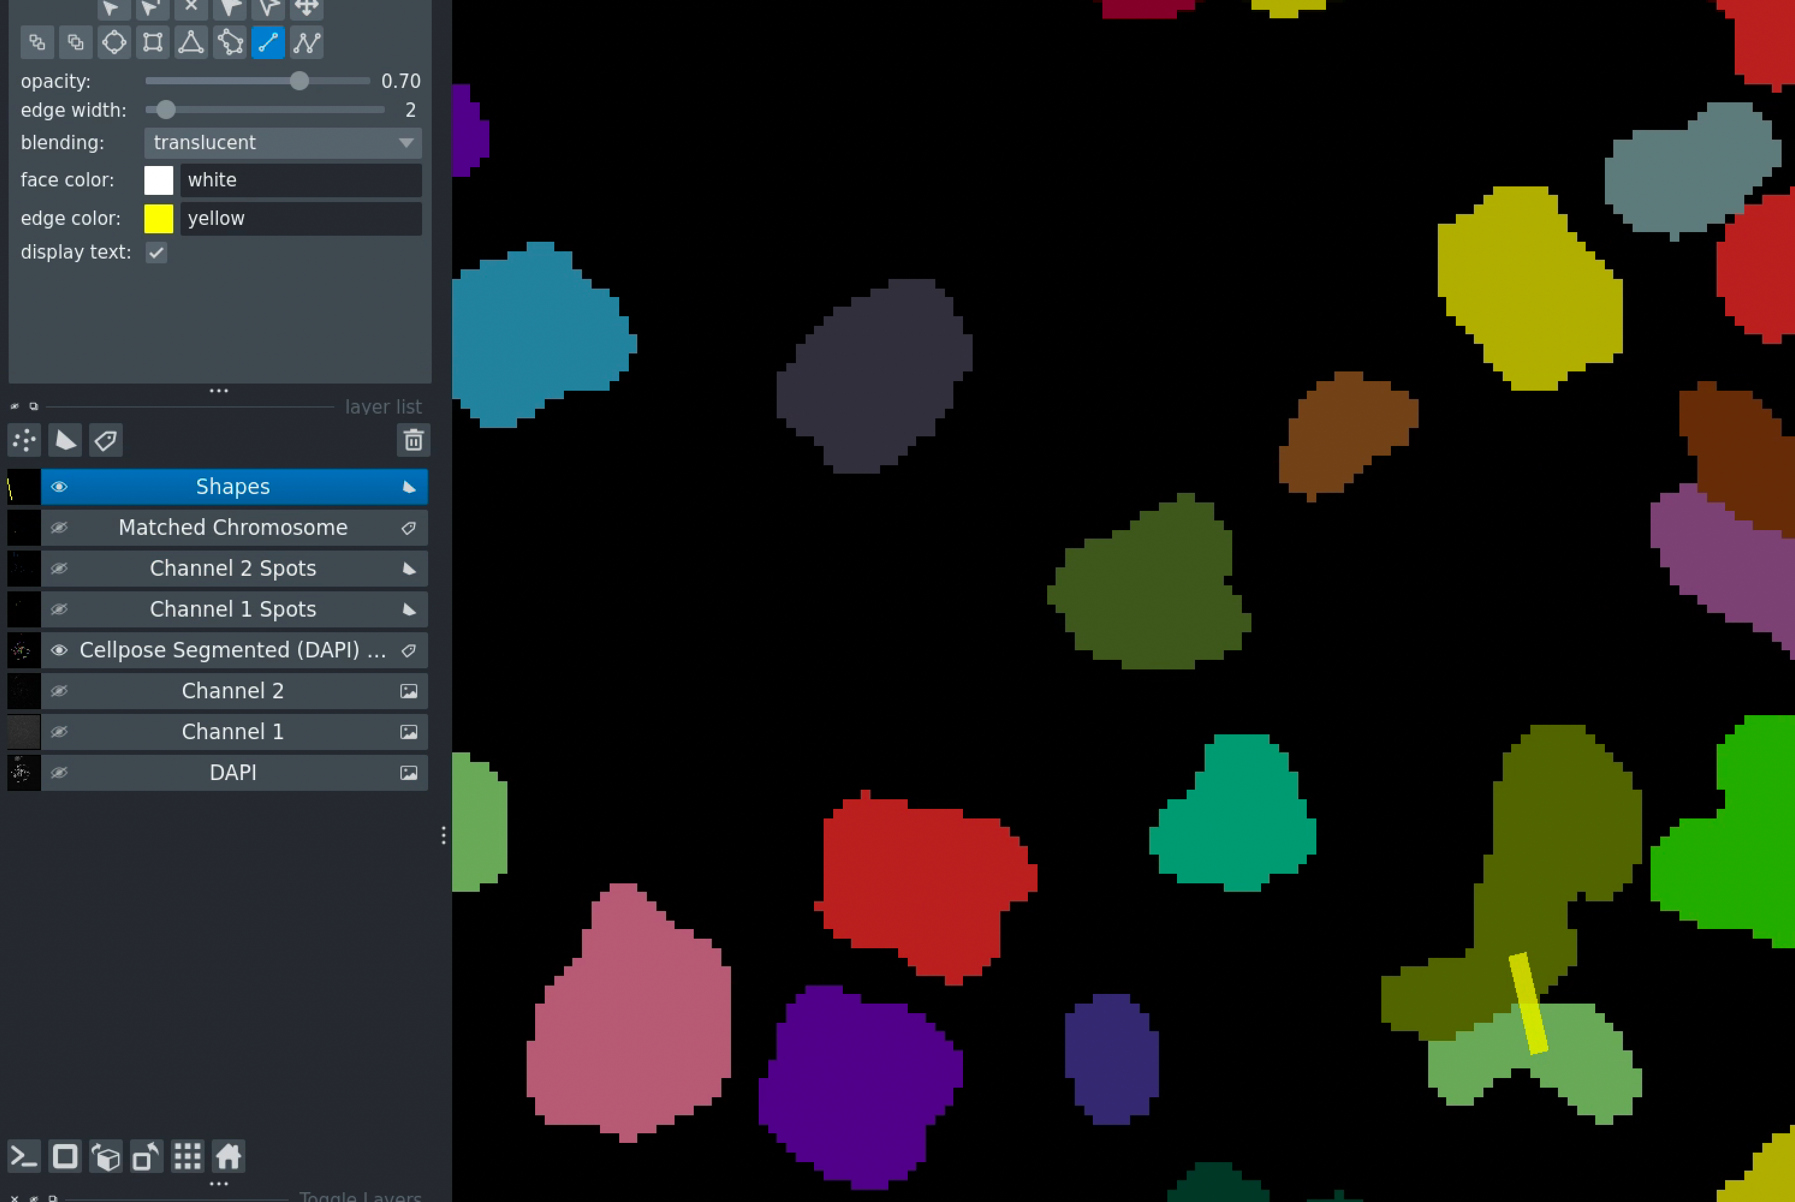
3. Draw the Merge Line
Select the Polygon/Line drawing tool from the top toolbar
Click on the first chromosome region you want to merge
Continue drawing a line to the second region
The line should cross both regions
Double-click to finish drawing
Tip
The line doesn’t need to be straight - just make sure it touches both regions you want to merge.
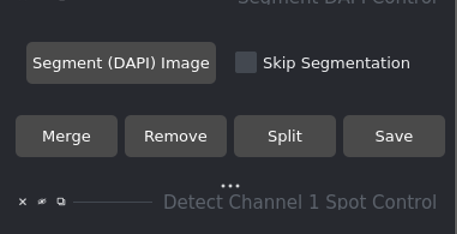
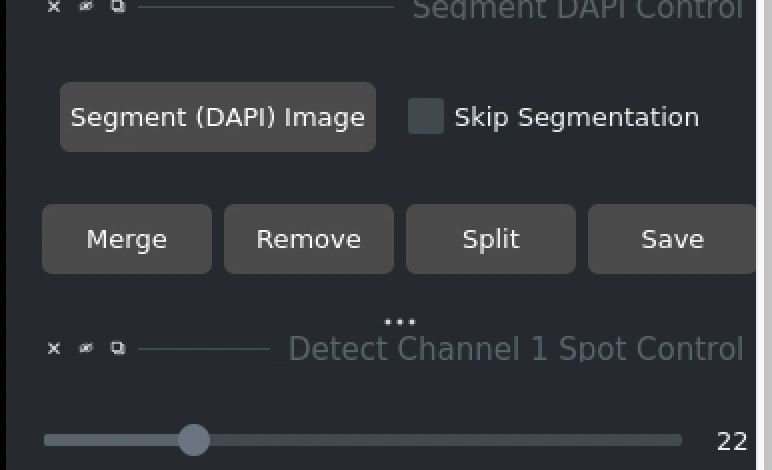
4. Execute the Merge
Click the Merge Chromosomes button
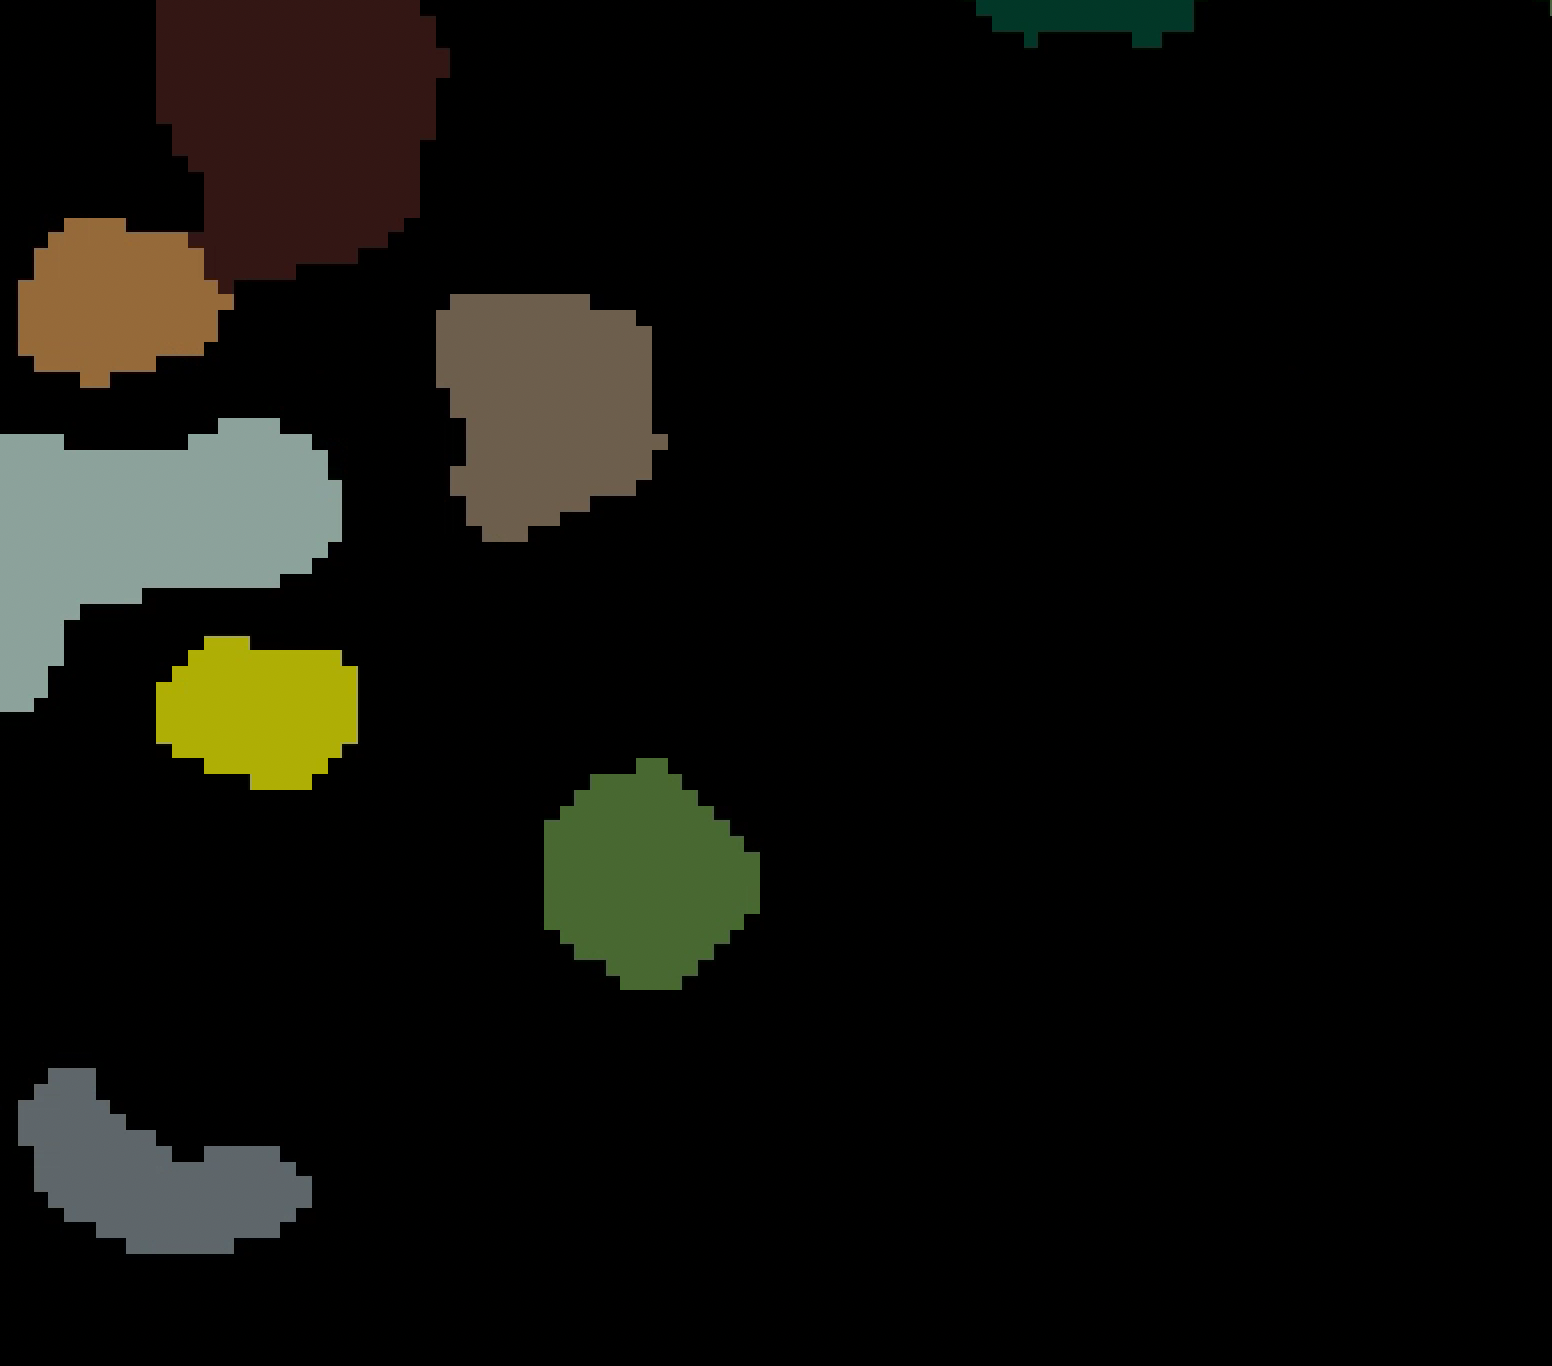
Result:
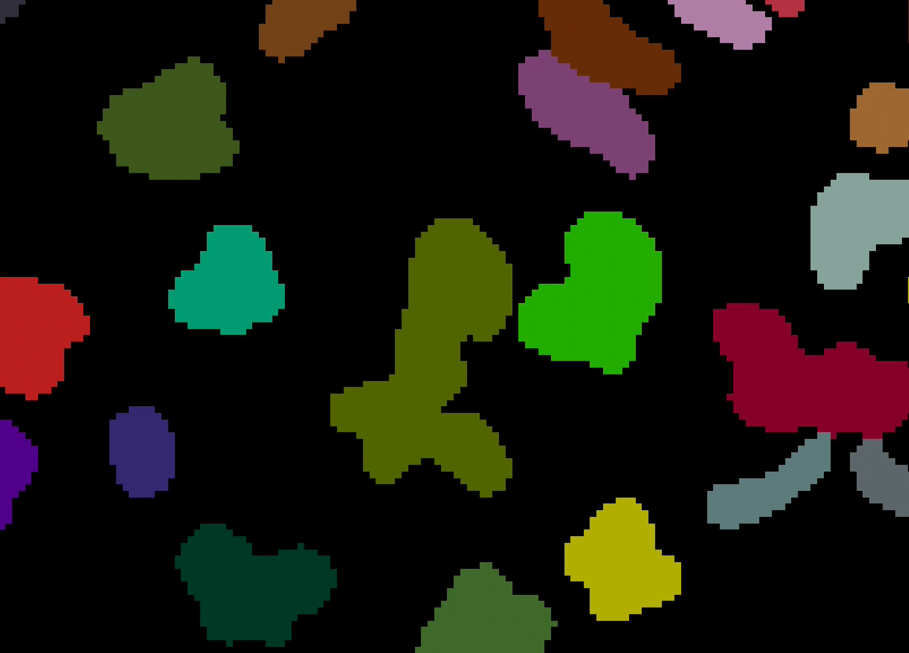
Result after merging - regions are now combined
The two regions are combined into one
They now share the same label/color
The shapes layer drawing is removed
Segmentation layer is updated
5. Save Your Work
Click Save to preserve the correction
Important
Without saving, the merge will be lost when you load a different image or close the application.
Removing Chromosomes
Use when you want to exclude specific chromosomes from analysis (e.g., edge chromosomes, debris, artifacts).
Drawing over a chromosome to mark it for removal
Step-by-Step Process
1. Select the Shapes Layer
Click on the Shapes layer in the layer list
Ensure it’s highlighted/selected
2. Draw Over the Chromosome
Select the Polygon/Line drawing tool
Draw a line through the chromosome you want to remove
The line must cross or cover part of the chromosome
Double-click to finish
Tip
You can draw multiple shapes to mark multiple chromosomes before clicking Remove.
3. Execute the Removal
Click the Remove button
Result:
Updated segmentation excluding the removed chromosome
The marked chromosome(s) are removed from the segmentation
The label is set to 0 (background)
Other chromosomes remain unchanged
4. Save the Changes
Save your corrections
Click Save to store the updated segmentation
Note
Saved corrections are loaded automatically next time you open this image set.
Deleting Spots
Use manual spot deletion to remove false positives from either channel.
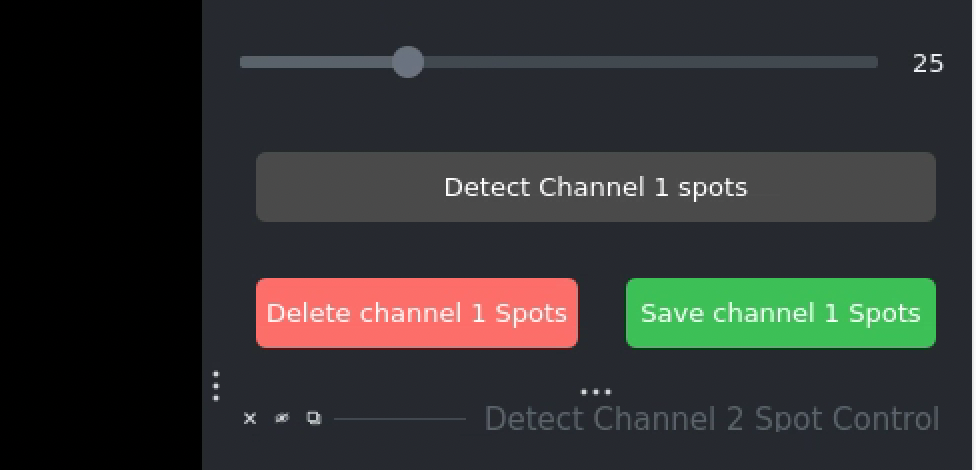
Deleting Channel 1 Spots (DNA-FISH)
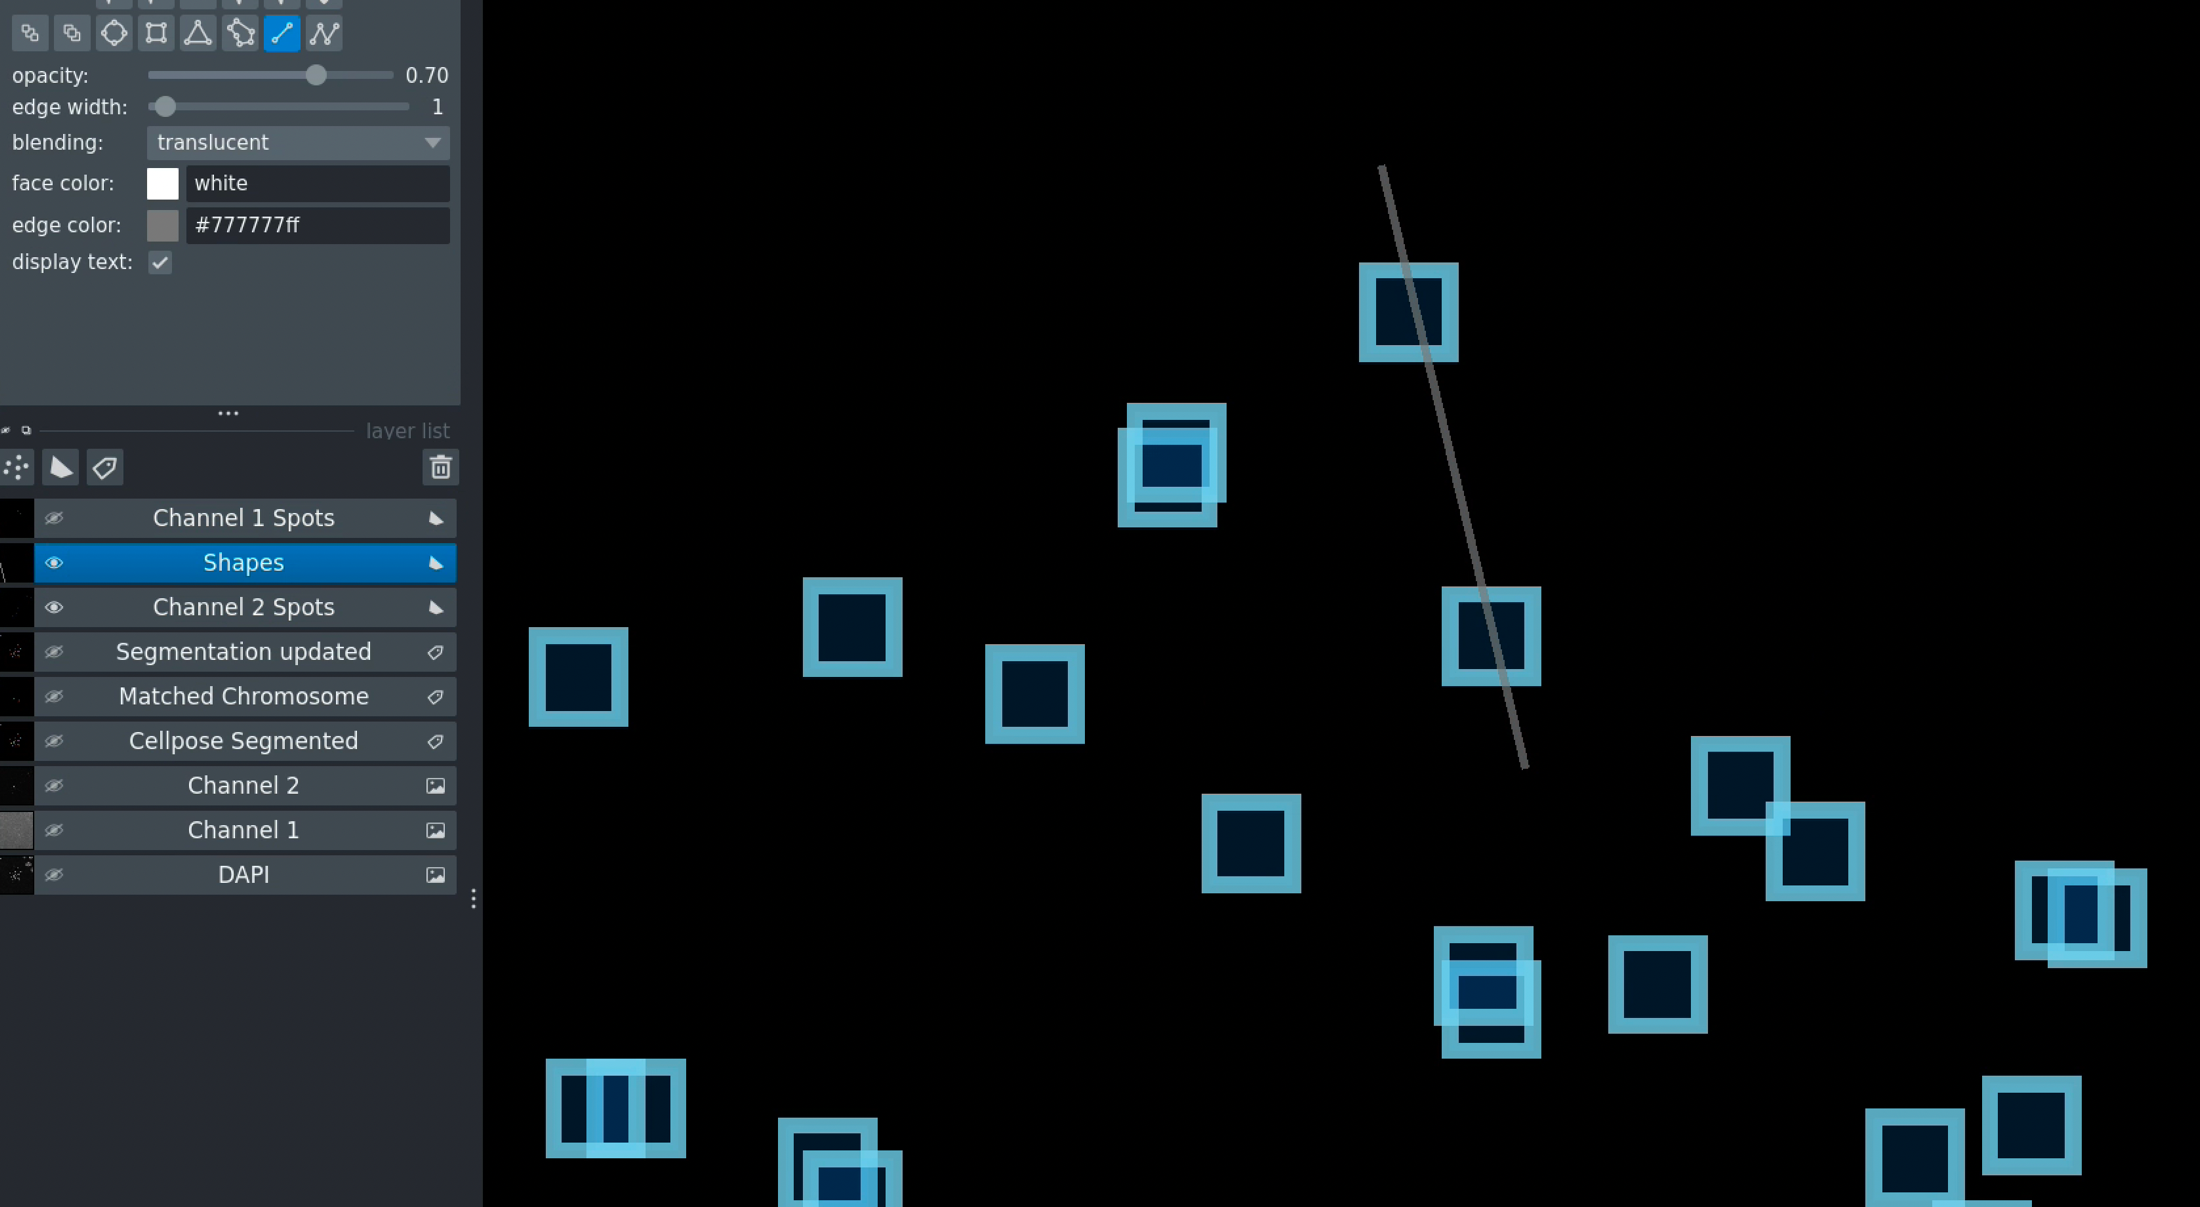
Draw shapes over spots to mark them for deletion
Process:
Select the Shapes layer
Draw shapes (rectangles, circles, or polygons) over spots you want to delete
The shape must overlap or cover the spot
Click Delete Channel 1 Spots
Result:
Updated spot layer after deletion
Spots intersecting with drawn shapes are removed
The Channel 1 spots layer is updated
Shape drawings are cleared
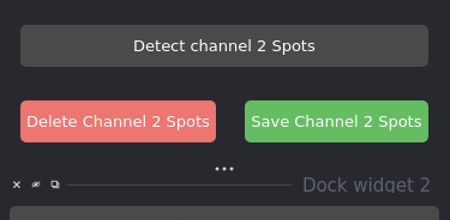
Deleting Channel 2 Spots (CENP-C)
Interface for deleting Channel 2 spots
Same process as Channel 1:
Select Shapes layer
Draw shapes over spots to delete
Click Delete Channel 2 Spots
Result:
Channel 2 spots after manual correction
Multiple spots can be deleted at once by drawing multiple shapes or one large shape covering all targets.
Save Spot Corrections:
Click Save to preserve spot deletions
Important
If you don’t save:
Corrections are lost when switching images
Reloading the image will show original detected spots
Batch processing will use original detection
Drawing Tools and Tips
Napari Drawing Tools
Available Tools:
Rectangle: Draw rectangular selection boxes
Ellipse: Draw circular/elliptical selections
Polygon: Draw freeform polygons
Line: Draw straight or curved lines
How to Use:
Click the tool icon in the toolbar
Click and drag to draw
Double-click to finish (for polygon/line)
Press Escape to cancel
Tool Shortcuts:
Z: Zoom tool
P: Pan tool
Delete: Remove selected shape
Ctrl/Cmd + Z: Undo last action
Drawing Best Practices
For Merging Chromosomes:
Draw a clear line connecting both regions
Line should touch both chromosomes
Doesn’t need to be precise - just connect them
Can be straight or curved
For Removing Chromosomes:
Line must intersect the chromosome
Can draw through multiple chromosomes for batch removal
Partial overlap is sufficient
For Deleting Spots:
Shape must overlap the spot
Drawing a circle/rectangle around spots is easiest
Can select multiple spots with one large shape
Zoom in for precise selection
Common Drawing Issues
Problem: Shapes appear on the wrong layer
Solution: Click the Shapes layer to select it before drawing
Problem: Can’t see the shapes I’m drawing
Solution: Toggle the shapes layer visibility (eye icon)
Problem: Double-click doesn’t finish the polygon
Solution: Try triple-clicking or pressing Enter
Problem: Accidental shapes drawn
Solution: Select the shape and press Delete, or clear all with Clear Shapes button
Saving and Loading Corrections
Saving Corrections
Click the Save button after making any corrections.
What Gets Saved:
Updated segmentation masks
Modified spot labels
Correction timestamps
Original files remain unchanged
File Locations:
Corrections are saved as:
`
folder_name/
├── folder_name_segmentation_corrected.npy
├── folder_name_channel1_spots_corrected.npy
└── folder_name_channel2_spots_corrected.npy
`
Loading Previous Corrections
Automatic Loading:
When you load an image set that has saved corrections:
Corrected segmentation loads automatically
Corrected spot layers load automatically
No need to re-apply corrections
Verification:
Check the console/terminal output:
``` Loading image set: sample_001
Found corrected segmentation: sample_001_segmentation_corrected.npy
Found corrected Channel 1 spots
Found corrected Channel 2 spots
Loaded with corrections.
Reverting Corrections
To discard corrections and start over:
Delete the
*_corrected.npyfilesReload the image set
Original automated results will load
Correction Workflow for Batch Processing
When batch processing produces results that need correction:
Approach 1: Pre-Correction (Recommended)
Process a few representative images manually
Apply and save corrections
Run batch processing with “Use Saved Results”
Corrected versions will be used automatically
Approach 2: Post-Correction
Run batch processing on all images
Review results and identify images needing correction
Load problematic images individually
Apply and save corrections
Re-run analysis for those specific images
Best Practices
When Making Corrections:
✅ Zoom in for better precision
✅ Toggle layer visibility to see clearly
✅ Save after each correction
✅ Verify the correction worked before moving on
✅ Document significant corrections
Quality Control:
Review a random sample of automated results
Focus corrections on critical samples
Keep track of correction frequency (high frequency may indicate parameter issues)
Consider adjusting thresholds if corrections are needed often
Time Management:
Manual correction takes 1-5 minutes per image
Reserve for important samples
Use optimized automated parameters for most images
Batch process first, then correct outliers
Documentation:
Keep notes on:
Which images were corrected
Type of corrections made
Reasons for corrections
Any systematic issues observed
Limitations and Considerations
Subjectivity:
Manual corrections introduce subjective judgment
Different users may correct differently
Establish clear criteria for corrections
Consider inter-user validation for publications
Time Investment:
Manual correction is time-consuming
Not practical for very large datasets
Reserve for critical samples
Prefer parameter optimization over extensive corrections
Reproducibility:
Automated methods are more reproducible
Document all manual corrections
Save correction files with results
Include correction information in methods sections
Next Steps
Basic Workflow - Complete analysis workflow
Batch Processing - Process multiple images
Advanced Features - Additional features
Troubleshooting - Common issues and solutions